. 2025 May;12(18):e2500952.
doi: 10.1002/advs.202500952. Epub 2025 Mar 17.

IL-33-Induced TREM2+ Macrophages Promote Pathological New Bone Formation Through CREG1-IGF2R Axis in Ankylosing Spondylitis

Affiliations

IL-33-Induced TREM2+ Macrophages Promote Pathological New Bone Formation Through CREG1-IGF2R Axis in Ankylosing Spondylitis

Wenjun Hao et al. Adv Sci (Weinh). 2025 May.

Abstract

Pathological new bone formation is the main cause of disability in ankylosing spondylitis (AS), and so far, it lacks a targeted therapy. Macrophages are central orchestrators of inflammation progression and tissue remodeling, but their contribution to pathological new bone formation has largely not been explored. Here, it is identified that TREM2+ macrophages predominated within the sites of new bone formation and adjacent to osteogenic precursor cells. In vivo, both depletion of macrophages and knockout of Trem2 significantly reduced pathological new bone formation in a collagen antibody-induced arthritis (CAIA) model. Specifically, TREM2+ macrophages promoted osteogenic differentiation of ligament-derived progenitor cells (LDPCs) by secreting CREG1, a secretory glycoprotein involved in cell differentiation and normal physiology. CREG1-IGF2R-PI3K-AKT signaling pathway is involved in TREM2+ macrophage-mediated pathological new bone formation. In addition, it is found that IL-33 promoted TREM2+ macrophage differentiation through phosphorylation of STAT6. Targeting the above signalings alleviated new bone formation in the CAIA model. The findings highlight the critical role of IL-33-induced TREM2+ macrophages in pathological new bone formation and provide potential therapeutic targets for halting spinal ankylosis in AS.

Keywords: CREG1; IL33; TREM2+ macrophages; ankylosing spondylitis; pathological new bone formation.


Conflict of interest statement

The authors declare no conflict of interest.

Figures
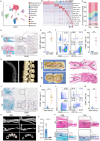
Figure 1
Figure 1
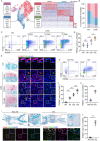
Macrophages are enriched in the enthesis and play an essential role in pathological bone formation. A) Uniform manifold approximation and projection (UMAP) of scRNA‐Seq of all cells from control and CAIA model. Colors and numbers indicate scRNA‐Seq clusters or cell type annotations. B) Heat map of canonical markers of distinct cell clusters. C) Frequencies from scRNA‐seq data of cell subsets from control and CAIA. D,E) SOFG staining, IHC analysis, and quantitative analysis of macrophages in hind paws of CAIA model. n = 6 per group. Scale bar: 100 µm. F,G) Flow cytometry analysis and quantitative analysis of macrophages and in hind paws of CAIA model. n = 6 per group. H) Illustration of human spinal ligament tissue collection. I) Schematic diagram of the anatomy of the spinal ligament and hematoxylin‐eosin (H&E) staining. The red circles indicate pathological new bone; The red asterisks indicate uncalcified ligaments, the potential site of pathological new bone formation; The rose red rectangles represent the location of the H&E on the right. Scale bar: 1.5 cm (left), 5 mm (right). J,K) Safranin O Fast Green (SOFG) staining, IHC analysis, and quantitative analysis of macrophages and in spinal ligament tissues from patients with AS and non‐AS patients. n = 12 per group. Scale bar: 100 µm. L,M) Flow cytometry analysis and quantitative analysis of macrophages and in entheseal tissues from patients with AS and non‐AS patients. n = 6 per group. N,O) µCT images and quantitative analysis of pathological new bone formation in PBS and clodronate‐treated CAIA model. n = 6 per group. Scale bar: 1.5 mm. P) H&E staining and SOFG staining in hind paws of PBS and clodronate‐treated CAIA model. Scale bar: 200 µm. Data is shown as mean±SD. ** p < 0.01 determined by unpaired, two‐tailed Student's t‐test. AS, ankylosing spondylitis; CAIA, collagen antibody‐induced arthritis; Ctrl, control; IL, interspinous ligament; SL, supraspinous ligament; SP, spinous process; Cold, clodronate; BV, bone volume; CB, cortical bone; NB, new bone.
Figure 2
Figure 2
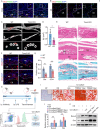
TREM2+ macrophages are the predominant macrophage subsets in enthesis from the AS and CAIA models. A) UMAP of scRNA‐seq data from macrophages (left) and heat map of canonical markers of each macrophage cluster (right). B) Frequencies from scRNA‐seq data of macrophage subsets from control and CAIA model. C,D) Flow cytometry analysis and quantitative analysis of TREM2+ macrophages in hind paws of control and CAIA model. n = 6 per group. One‐way ANOVA with Tukey's post hoc test. E,F) SOFG staining and double IF staining in hind paws of CAIA model, including staining for F4/80 and TREM2, Scale bar: 100 µm. Semiquantitative analysis of TREM2 colocalization. n = 6 per group. One‐way ANOVA with Tukey's post hoc test. G,H) Flow cytometry analysis and quantitative analysis of TREM2+ macrophages in spinal ligament tissues from patients with AS and non‐AS. n = 5 per group. Student's t‐test. I,J) SOFG staining and double IF staining in spinal ligament tissues from patients with AS and non‐AS, including staining for CD68 and TREM2, Scale bar: 100 µm. Semiquantitative analysis of TREM2 colocalization. n = 6 per group. Student's t‐test. Data is shown as mean±SD. * p < 0.05; ** p < 0.01; ns, not significant (P > 0.05). AS, ankylosing spondylitis; CAIA, collagen antibody‐induced arthritis; Ctrl, control.
Figure 3
Figure 3
TREM2+ macrophages promote pathological new bone formation. A) Double IF staining in hind paws of CAIA model, including staining for TREM2 and Sp7, Scale bar: 200 µm. B) Double IF staining in spinal ligament tissues from patients with AS, including staining for TREM2 and Sp7. Scale bar: 200 µm. C,D) µCT images and quantitative analysis of hind paws of CAIA model with and without Trem2 knockout. n = 6 per group. Scale bar: 1.5 mm. Student's t‐test. E) H&E staining and SOFG staining in hind paws of CAIA model with and without Trem2 knockout. Scale bar: 200 µm. F) IF analysis of Runx2, Osx in CAIA model with and without Trem2 knockout. Scale bar: 200 µm. G) Quantitative analysis of Runx2, Osx cell rate. n = 5 per group. Student's t‐test. H) Illustration of collection of macrophages and co‐cultured with LDPCs. I) Alizarin Red staining of ligament stem cells co‐cultured with macrophages. Scale bar: 100 µm. J,K) RT‐qPCR analysis and immunoblot analysis of the level of Runx2, Osx of ligament stem cells co‐cultured with macrophages. One‐way ANOVA with Tukey's post hoc test. Data is shown as mean±SD. * p < 0.05; ** p < 0.01. AS, ankylosing spondylitis; CAIA, collagen antibody‐induced arthritis; BV, bone volume; Veh, vehicle.
Figure 4
Figure 4
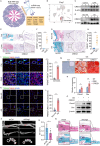
TREM2+ macrophages promote pathological new bone formation by secreted CREG1 A) Dynamic network venn diagram of secretory protein upregulated genes form the bulk RNA‐seq of spinal ligament tissue for patients with patients of AS and non‐AS and from the TREM2+ macrophage subsets of the scRNA‐seq dataset. B) Feature plots displaying the single‐cell expression of Creg1. C) Immunoblot analysis of expression of CREG1 in hind paws of control and CAIA model D) Immunoblot analysis of expression of CREG1 in spinal ligament tissues from patients with AS and non‐AS patients. E,F) SOFG staining, IHC analysis, and quantitative analysis of CREG1 in hind paws of CAIA model. n = 6 per group. Scale bar: 200 µm. G,H) SOFG staining, IHC analysis, and quantitative analysis of CREG1 in spinal ligament tissues from patients with AS and non‐AS patients. n = 12 per group. Scale bar: 200 µm. I,J) Double IF staining and quantitative analysis in hind paws of CAIA model and control, including staining for TREM2 and CREG1. Scale bar: 200 µm. K,L) Double IF staining and quantitative analysis in spinal ligament tissues from patients with AS and non‐AS, including staining for TREM2 and CREG1. Scale bar: 200 µm. M) Alizarin Red staining of LDPCs treatment with CREG1 for 14 days. Scale bar: 100 µm. N,O) RT‐qPCR analysis and immunoblot analysis of the level of Runx2, Osx of LDPCs treatment with creg1. P,Q) µCT images and quantitative analysis of pathological new bone formation in CAIA model with the administration of shCtrl or shILcreg1 for 4 weeks. n = 6 per group. Scale bar: 1.5 mm. R) H&E staining and SOFG staining in hind paws of shCtrl or shCreg1 treated CAIA model. Scale bar: 200 µm. Data is shown as mean±SD. * p < 0.05; ** p < 0.01 determined by unpaired, two‐tailed Student's t‐test. AS, ankylosing spondylitis; CAIA, collagen antibody‐induced arthritis; BV, bone volume; CB, cortical bone; NB, new bone.
Figure 5
Figure 5
CREG1 promotes osteogenesis by activating PI3K‐AKT signaling. A) GO analysis of upregulated genes in the CREG1 group compared to the PBS group. B) KEGG analysis of upregulated genes in the CREG1 group compared to the PBS group. C) Immunoblot analysis of expression of the level of AKT and pAKT in LDPCs treatment with CREG1. D) Violin plot of Igf2r expression in different clusters in scRNA sequencing. E) Immunoblot analysis of AKT and pAKT level expression after knockdown of IGF2r in LDPCs and treatment with CREG1. F) Alizarin Red staining of LDPCs with knockdown of Igf2r and treatment with CREG1 for 14 days. Scale bar: 100 µm. G,H) RT‐qPCR analysis and immunoblot analysis of the level of Runx2, and Osx of LDPCs with knockdown of Igf2r and treatment with CREG1. I,J) Double IF staining and quantitative analysis in hind paws of CAIA model and control, including staining for IGF2R and pAKT. Scale bar: 200 µm. K,L) Double IF staining and quantitative analysis in spinal ligament tissues from patients with AS and non‐AS, including staining for IGF2R and pAKT. Scale bar: 200 µm. M) Alizarin Red staining of LDPCs with MK2206 and treatment with CREG1 for 14 days. Scale bar: 100 µm. N,O) RT‐qPCR analysis and immunoblot analysis of the level of Runx2, Osx of LDPCs with 抑制剂 and treatment with CREG1. Data is shown as mean±SD. * p < 0.05; ** p < 0.01 determined by unpaired, two‐tailed Student's t‐test. AS, ankylosing spondylitis; CAIA, collagen antibody‐induced arthritis; Ctrl, control; BV, bone volume; CB, cortical bone; NB, new bone.
Figure 6
Figure 6
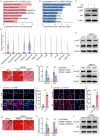
TREM2+ macrophage differentiation is induced by IL‐33. A) MA plot of upregulated and downregulated genes from human spinal enthesel tissues of non‐AS and AS groups. Red and blue dots indicate significantly up‐and down‐regulated genes, respectively (adjusted P < 0.01). Red diamonds indicate genes encoding cytokines, black diamonds indicate genes encoding immune‐related. B) Circos plots show the enrichment score of cytokine‐induced gene set in macrophages from both the control and the CAIA model. C) Circos plots show the enrichment score of cytokine‐induced gene set in each subset of macrophages. D) Immunoblot analysis of expression of IL‐33 in human spinal tissue. E) Immunoblot analysis of expression of IL‐33 in spinal ligament tissues from patients with AS and non‐AS patients. F,G) SOFG staining, IHC analysis, and quantitative analysis of IL‐33 in hind paws of CAIA model. n = 6 per group. Scale bar: 200 µm. H,I) SOFG staining, IHC analysis, and quantitative analysis of IL‐33 in spinal ligament tissues from patients with AS and non‐AS patients. n = 12 per group. Scale bar: 200 µm. J) Flow cytometry analysis of TREM2 expression in IL‐33–induced macrophages from BMDMs. K) Immunocytochemical (ICC) staining of BMDMs by TREM2 and F4/80 after IL‐33 treatment for 3 days (shown is one representative result from n = 3 BRs). Scale bar: 20 µm. L) Flow cytometry analysis of TREM2+ macrophages in the CAIA model with the administration of shCtrl or shIL‐33 for 10d. M) Quantitative analysis of TREM2+ macrophage cells in (J). n = 5 per group. N,O) µCT images and quantitative analysis of pathological new bone formation in CAIA model with the administration of shCtrl or shIL‐33 for 4 weeks. Scale bar: 1.5 mm. n = 8 per group. P) H&E staining and SOFG staining in hind paws of shCtrl or shIL‐33 treated CAIA model. Scale bar: 200 µm. Data is shown as mean±SD. * p < 0.05; ** p < 0.01 determined by unpaired, two‐tailed Student's t‐test. AS, ankylosing spondylitis; CAIA, collagen antibody‐induced arthritis; Ctrl, control; BV, bone volume; CB, cortical bone; NB, new bone.
Figure 7
Figure 7
IL‐33 induces macrophage differentiation through STAT6 signaling. A) GO and KEGG analysis of upregulated genes in the IL‐33 group compared to the PBS group. B) Double IF staining of TREM2 and p‐STAT6 in hind paws of the CAIA model and in spinal ligament tissues from patients with AS, n = 6 per group. Scale bar: 3mm. Scale bar: 200 µm. C) Quantitative analysis of TREM2 and p‐STAT6 colocalization. n = 6 per group. D) Immunoblot analysis of STAT6, p‐STAT6 in BMDMs after IL‐33 treatment for 1 h with or without ST2 antibody. E) ICC staining of BMDMs by p‐STAT6 after IL‐33 treatment for 1 h with or without ST2 antibody (shown is one representative result from n = 5 BRs). Scale bar: 20 µm. F) Flow cytometry analysis of TREM2 expression in IL‐33–induced macrophages from BMDMs with the application of AS1517499 or DMSO for 48 h G) Quantitative analysis of TREM2+ macrophages in (F). H) Flow cytometry analysis of TREM2+ macrophages in the CAIA model with administration of AS1517499 or DMSO for 10 days. I) Quantitative analysis of TREM2+ macrophages in (H). J,K) µCT images and quantitative analysis of pathological new bone formation in CAIA model with administration of DMSO or AS1517499 for 4 weeks. n = 6 per group. Scale bar: 1.5 mm. L) H&E staining and SOFG staining in the hind paws of the CAIA model. Scale bar: 200 µm. Data is shown as mean±SD. ** p < 0.01; ns, not significant (P > 0.05) determined by unpaired, two‐tailed Student's t‐test. AS, ankylosing spondylitis; CAIA, collagen antibody‐induced arthritis; Ctrl, control; Ab, Rat Anti‐Mouse ST2/IL‐33R Monoclonal Antibody; DMSO, dimethyl sulfoxide; AS1517499, STAT6 inhibitor; BV, bone volume; CB, cortical bone; NB, new bone.

References

    1. Sieper J., Poddubnyy D., Lancet 2017, 390, 73. - PubMed
    1. Navarro‐Compan V., Sepriano A., El‐Zorkany B., van der Heijde D., Ann. Rheum. Dis. 2021, 80, 1511. - PubMed
    1. Malinowski K. P., Kawalec P., Expert Rev. Pharmacoecon. Outcomes Res. 2015, 15, 285. - PubMed
    1. Lories R., Nat. Rev. Rheumatol. 2011, 7, 700. - PubMed
    1. Ward M. M., Deodhar A., Gensler L. S., Dubreuil M., Yu D., Khan M. A., Haroon N., Borenstein D., Wang R., Biehl A., Fang M. A., Louie G., Majithia V., Ng B., Bigham R., Pianin M., Shah A. A., Sullivan N., Turgunbaev M., Oristaglio J., Turner A., Maksymowych W. P., Caplan L., Arthritis Care Res. 2019, 71, 1285. - PMC - PubMed

MeSH terms

LinkOut - more resources