Sex-Specific Methylomic and Transcriptomic Responses of the Avian Pineal Gland to Unpredictable Illumination Patterns
- PMID: 40091567
- PMCID: PMC11911909
- DOI: 10.1111/jpi.70040
Sex-Specific Methylomic and Transcriptomic Responses of the Avian Pineal Gland to Unpredictable Illumination Patterns
Abstract
In the production environment of chickens, exposure to unpredictable light patterns is a common painless stressor, widely used to influence growth rate and egg production efficiency. The pineal gland, a key regulator of circadian rhythms through melatonin secretion, responds to environmental light cues, and its function is modulated by epigenetic mechanisms. In this study, we investigated how the pineal gland methylome and transcriptome (including micro-RNAs) interact to respond to a rearing exposure to unpredictable illumination patterns, with a particular focus on sex differences. We conducted an integrative multi-omic analysis-including methylomic (MeDIP-seq), transcriptomic (RNA-seq), and miRNA expression profiling-on the pineal gland of Hy-Line White chickens (n = 34, 18 females, 16 males) exposed to either a standard 12:12 light-dark cycle (control) or a randomized, unpredictable light schedule from Days 3 to 24 post-hatch. Our findings reveal that unpredictable light exposure alters the pineal gland methylome and transcriptome in a sex-specific manner. However, while transcriptomic differences between sexes increased due to the stress, methylomic differences decreased, particularly on the Z chromosome. These changes were driven by females (the heterogametic sex in birds), which became more male-like in their pineal methylome after exposure to the illumination stress, leading to reduced epigenetic sexual dimorphism while maintaining differences at the gene expression level. Further, we implemented a fixed sex effect model as a biological proof of concept, identifying a network of 12 key core genes interacting with 102 other genes, all linked to circadian regulation and stress adaptation. This network of genes comprises a core regulatory framework for circadian response. Additionally, tissue-specific expression analysis and cell-type specific expression analysis revealed enrichment in brain regions critical for circadian function, including neuronal populations involved in circadian regulation and the hypothalamic-pituitary-thyroid axis. Together, these findings provide strong evidence of sex-specific epigenetic transcriptomic responses of the pineal gland upon illumination stress and offer valuable insights into the interplay of different omic levels in relation to circadian response.
Keywords: circadian; epigenetics; gene expression; illumination; light; methylome; miRNA; pineal gland; sex differences; transcriptomic.
© 2025 The Author(s). Journal of Pineal Research published by John Wiley & Sons Ltd.
Conflict of interest statement
The authors declare no conflicts of interest.
Figures


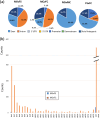
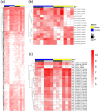
 ), windows from DMR (
 ), and miRNA from DMiR (
 ) analysis.


Similar articles
-
Retinal illumination phase shifts the circadian rhythm of serotonin N-acetyltransferase activity in the chicken pineal gland.Neurosci Lett. 2004 Apr 29;360(3):153-6. doi: 10.1016/j.neulet.2004.02.062. Neurosci Lett. 2004. PMID: 15082156
-
Development and control of the circadian pacemaker for melatonin release in the chicken pineal gland.Gen Comp Endocrinol. 1998 Apr;110(1):19-28. doi: 10.1006/gcen.1997.7039. Gen Comp Endocrinol. 1998. PMID: 9514840
-
Regulation of pineal melatonin secretion: comparison between mammals and birds.Acta Biol Hung. 1996;47(1-4):313-22. Acta Biol Hung. 1996. PMID: 9124002
-
Static and extremely low frequency electromagnetic field exposure: reported effects on the circadian production of melatonin.J Cell Biochem. 1993 Apr;51(4):394-403. doi: 10.1002/jcb.2400510403. J Cell Biochem. 1993. PMID: 8098713 Review.
-
Pineal factors in the control of testicular function.Adv Sex Horm Res. 1976;2:87-139. Adv Sex Horm Res. 1976. PMID: 797250 Review.
References
-
- Morgan K. N. and Tromborg C. T., “Sources of Stress in Captivity,” Applied Animal Behaviour Science 102, no. 3–4 (February 2007): 262–302.
-
- Shini S., Shini A., and Huff G. R., “Effects of Chronic and Repeated Corticosterone Administration in Rearing Chickens on Physiology, the Onset of Lay and Egg Production of Hens,” Physiology & Behavior 98, no. 1–2 (August 2009): 73–77. - PubMed
-
- Nicol C., The Behavioural Biology of Chickens (Wallingford, 2015).
-
- Ikegami K. and Yoshimura T., “Comparative Analysis Reveals the Underlying Mechanism of Vertebrate Seasonal Reproduction,” General and Comparative Endocrinology 227 (February 2016): 64–68. - PubMed
MeSH terms
Substances
LinkOut - more resources
Full Text Sources

