. 2025 May;18(2):188-199.
doi: 10.21053/ceo.2024.00315. Epub 2025 Mar 17.

EFNA2 Mediates Stiffness-Regulated Hypopharyngeal Cancer Progression

Affiliations

EFNA2 Mediates Stiffness-Regulated Hypopharyngeal Cancer Progression

Songqun Hu et al. Clin Exp Otorhinolaryngol. 2025 May.

Abstract

Objectives: Hypopharyngeal cancer (HPC), originating from the hypopharyngeal mucosa, is associated with a poor prognosis. Extracellular matrix (ECM) stiffness is closely linked to tumor progression and patient outcomes. This study aimed to investigate the effects of matrix stiffness and to identify molecular markers relevant to HPC prognosis, with the goal of improving clinical outcomes.

Methods: Immunohistochemical analysis and cervical enhanced computed tomography (CT) data were used to evaluate correlations among CT values, matrix stiffness, and prognosis, and to develop a prognostic model for HPC. Cell culture models with varying matrix stiffness were established using polypropylene hydrogel. Western blotting, colony formation, EDU incorporation, and Transwell assays were employed to assess the effects of matrix stiffness on proliferation, migration, invasion, and epithelial-mesenchymal transition (EMT). High-throughput sequencing identified differentially expressed genes in HPC cells cultured on matrices of differing stiffness. Gene editing, in vivo subcutaneous tumorigenesis studies, and Western blotting were performed to elucidate the molecular mechanisms by which high matrix stiffness influences HPC progression and the role of ephrin A2 (EFNA2) in proliferation, migration, and EMT.

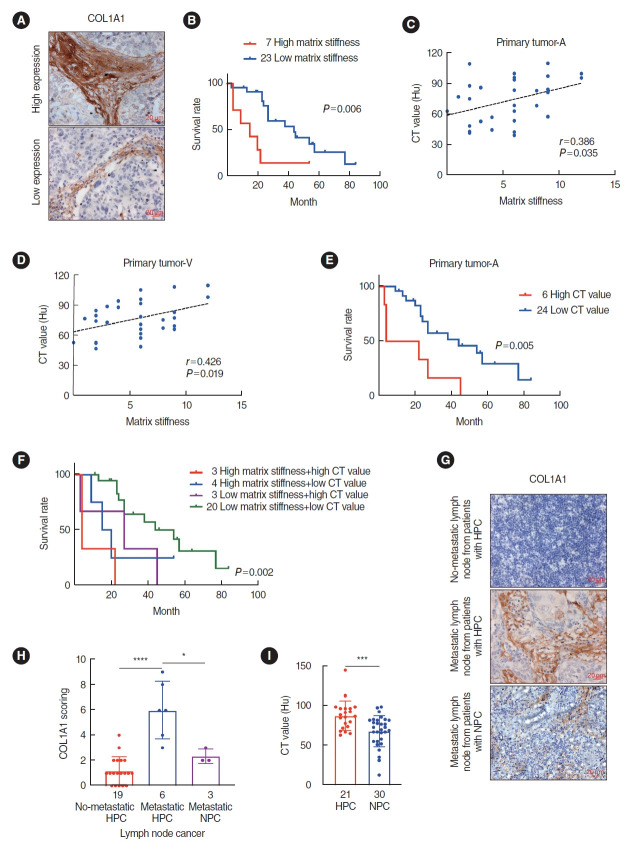
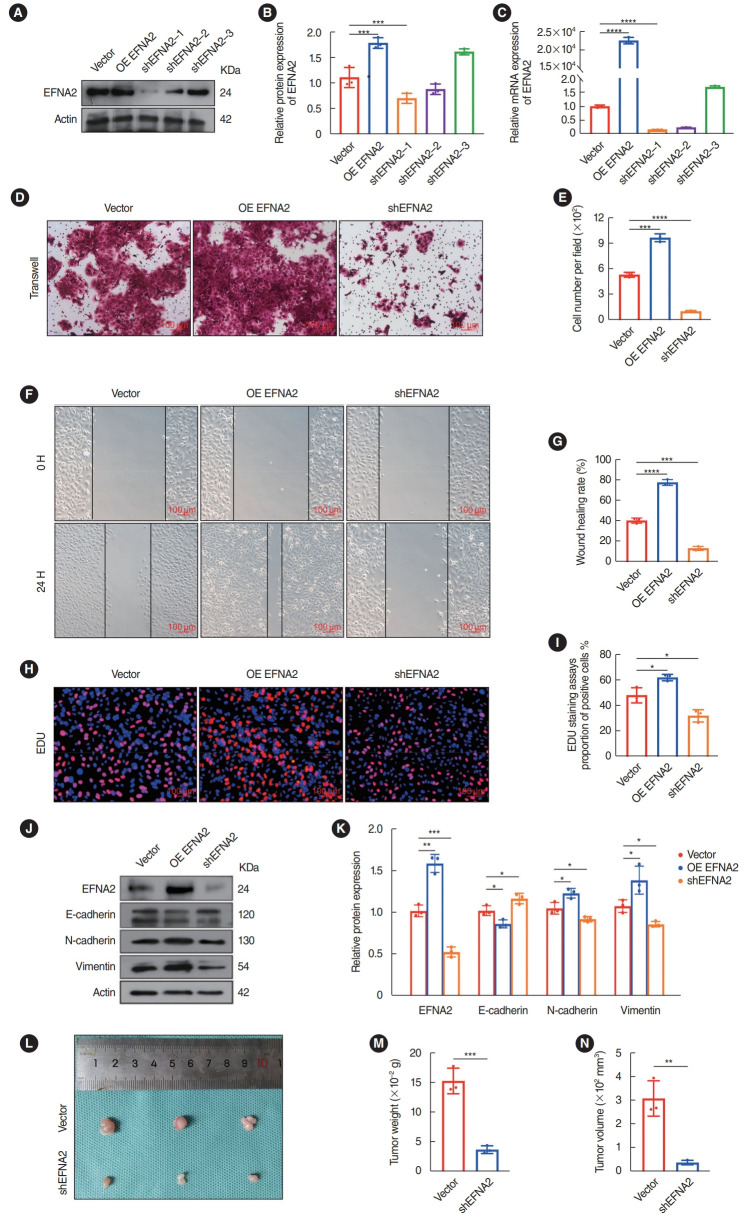
Results: Arterial phase CT values were positively correlated with matrix stiffness. Increased matrix stiffness was associated with lymph node metastasis, diminished therapeutic response, and poorer prognosis. Furthermore, metastatic lymph nodes in HPC patients exhibited higher CT values than those in patients with nasopharyngeal carcinoma. A high-stiffness ECM promoted proliferation, migration, and EMT in HPC cells. Mechanistically, a stiff ECM enhanced EFNA2 expression, thereby promoting proliferation, migration, EMT, and tumor growth in vivo.

Conclusion: EFNA2 and elevated matrix stiffness jointly contribute to the malignant phenotype in HPC. EFNA2 may represent a potential therapeutic target for managing HPC progression induced by high matrix stiffness.

Keywords: EFNA2; Epithelial-Mesenchymal Transition; Hypopharyngeal Carcinoma; Matrix Stiffness.


Conflict of interest statement

No potential conflict of interest relevant to this article was reported.

Figures

Fig. 1.
Fig. 1.
COL1A1 expression and arterial phase computed tomography (CT) values correlate with the prognosis of patients with hypopharyngeal cancer (HPC). (A) Representative images of immunohistochemical (IHC) for COL1A1 in HPC tumor tissues. Scale bar: 20 μm. (B) Kaplan-Meier analysis (log-rank test) of the overall survival in patients with HPC and different matrix stiffness values. (C) Pearson correlation analysis between matrix stiffness of tumor tissue and arterial phase CT values of tumor tissue under enhanced CT in HPC patients. (D) Pearson correlation analysis between matrix stiffness of tumor tissue and CT values of tumor tissue in the venous phase under enhanced CT in HPC patients. (E) Kaplan-Meier analysis (log-rank test) of the overall survival in patients with HPC and different CT values of tumor tissue in the arterial phase of enhanced CT. (F) Kaplan-Meier analysis (log-rank test) of the overall survival in patients with HPC and different matrix stiffness with different arterial phase CT values. (G) Representative images of IHC for COL1A1 in lymph nodes from patients with HPC and nasopharyngeal carcinoma (NPC). Scale bar: 20 μm. (H) Quantification of IHC staining scores of COL1A1 expression. Student t-test, mean±standard error of the mean (SEM), *P<0.05 and ****P<0.0001. (I) Quantification of arterial phase CT values of metastatic cervical lymph nodes from patients with HPC and NPC. Student t-test, mean±SEM, ***P<0.001.
Fig. 2.
Fig. 2.
Effect of different matrix stiffness on FaDu cell proliferation, migration, and epithelial-mesenchymal transition (EMT) processes. (A) Phalloidin staining of FaDu cells on different matrix stiffness, blue: 4´,6-diamidino-2-phenylindole (DAPI); red: ghost pen loop peptide; scale bar: 20 μm, the rightmost image is a merged image magnified four times. (B, C) The proliferation capacity of FaDu cells on different matrix stiffness using a colony formation assay, and quantification of the colony number. Student t-test, mean±standard error of the mean (SEM) (n=3), *P<0.05. (D, E) The proliferation capacity of FaDu cells on different matrix stiffness using an EDU staining assay, and quantification of the positive cells. Scale bar: 20 μm. Student t-test, mean±SEM (n=3), *P<0.05. (F, G) The migration capacity of FaDu cells on different matrix stiffness using a Transwell assay, and quantification of the number of cells that underwent migration. Scale bar: 100 μm. Student t-test, mean±SEM (n=3), ***P<0.001. (H, I) Western blot analysis of EMT-related genes and gray value analysis. Two-way analysis of variance, mean±SEM (n=3); *P<0.05 and ***P<0.001.
Fig. 3.
Fig. 3.
Analysis and validation of differentially expressed genes (DEGs) of FaDu cells cultured on different substrate hardness. (A) Volcano maps showing the DEGs between FaDu cells cultured on different matrix stiffness, as identified using RNA-seq. Red: upregulated DEGs; blue: downregulated DEGs. (B) Kyoto Encyclopedia of Genes and Genomes (KEGG) enrichment analysis of DEGs. (C) Venn diagram showing gene overlap in the PI3K-Akt signaling pathway, axon guidance pathway, and plasma membrane cellular localization. (D, E) Western blot analysis of ephrin A2 (EFNA2) and gray value analysis. Student t-test, mean± standard error of the mean (SEM) (n=3), **P<0.01. (F) Quantitative real-time polymerase chain reaction of EFNA2 in FaDu cells cultured on different matrix stiffness. Student t-test, mean±SEM (n=3), ***P<0.001.
Fig. 4.
Fig. 4.
Ephrin A2 (EFNA2) promotes FaDu cell proliferation and migration and the epithelial-mesenchymal transition (EMT) process. (A, B) Western blot analysis of EFNA2 in FaDu stable cell lines overexpressing and knocking down EFNA2, and gray value analysis. One-way analysis of variance (ANOVA), mean± standard error of the mean (SEM) (n=3), ***P<0.001. (C) Quantitative real-time polymerase chain reaction of EFNA2 mRNA expression in FaDu stable cell lines overexpressing and knocking down EFNA2. One-way ANOVA, mean±SEM (n=3), ****P<0.0001. (D, E) The migration capacity of vector, OE EFNA2, and shEFNA2 cells using a Transwell assay, and quantification of the number of cells that underwent migration in three groups. Scale bar: 100 μm. One-way ANOVA, mean±SEM (n=3), ***P<0.001 and ****P<0.0001. (F, G) The migration capacity of vector, OE EFNA2, and shEFNA2 cells using a cellular wound healing assay, and quantification of the wound healing rate in three groups. Scale bar: 100 μm. One-way ANOVA, mean±SEM (n=3), ***P<0.001 and ****P<0.0001. (H, I) The proliferation capacity of vector, OE EFNA2, and shEFNA2 cells using a EDU staining assay, and quantification of the positive cells in three groups. Scale bar: 100 μm. One-way ANOVA, mean±SEM (n=3), *P<0.05. (J, K) Western blot analysis of EFNA2 and EMT-related genes, and gray value analysis. Two-way ANOVA, mean±SEM (n=3), *P<0.05, **P<0.01, and ***P<0.001. (L) Representative nasopharyngeal carcinoma xenografts in the indicated group of mice (n=3 per group). (M, N) Tumor weight and volume were measured after the tumors were surgically dissected. Student t-test, mean±SEM, **P<0.01 and ***P<0.001.
Fig. 5.
Fig. 5.
Knockdown of ephrin A2 (EFNA2) inhibits the epithelial-mesenchymal transition (EMT) process induced by higher matrix stiffness in FaDu cells. (A, B) Western blot analysis of EFNA2 and EMT-related genes in FaDu-vector cells cultured on different matrix stiffness and FaDu-shEFNA2 cells cultured on high matrix stiffness, and gray value analysis. Two-way analysis of variance, mean±standard error of the mean (n=3); *P<0.05, **P<0.01, ***P<0.001, and ****P<0.0001.

Similar articles

References

    1. Chow LQM. Head and neck cancer. N Engl J Med. 2020 Jan;382(1):60–72. - PubMed
    1. Kwon DI, Miles BA, Education Committee of the American Head and Neck Society (AHNS) Hypopharyngeal carcinoma: do you know your guidelines. Head Neck. 2019 Mar;41(3):569–76. - PubMed
    1. Melica ME, La Regina G, Parri M, Peired AJ, Romagnani P, Lasagni L. Substrate stiffness modulates renal progenitor cell properties via a ROCK-mediated mechanotransduction mechanism. Cells. 2019 Dec;8(12):1561. - PMC - PubMed
    1. Wells RG. The role of matrix stiffness in regulating cell behavior. Hepatology. 2008 Apr;47(4):1394–400. - PubMed
    1. Feng J, Tang Y, Xu Y, Sun Q, Liao F, Han D. Substrate stiffness influences the outcome of antitumor drug screening in vitro. Clin Hemorheol Microcirc. 2013;55(1):121–31. - PubMed