. 2025 Mar 17;135(6):e185217.
doi: 10.1172/JCI185217.

Deep immunophenotyping reveals circulating activated lymphocytes in individuals at risk for rheumatoid arthritis

Affiliations

Deep immunophenotyping reveals circulating activated lymphocytes in individuals at risk for rheumatoid arthritis

Jun Inamo et al. J Clin Invest. .

Abstract

Rheumatoid arthritis (RA) is a systemic autoimmune disease currently with no universally highly effective prevention strategies. Identifying pathogenic immune phenotypes in at-risk populations prior to clinical onset is crucial to establishing effective prevention strategies. Here, we applied multimodal single-cell technologies (mass cytometry and CITE-Seq) to characterize the immunophenotypes in blood from at-risk individuals (ARIs) identified through the presence of serum antibodies against citrullinated protein antigens (ACPAs) and/or first-degree relative (FDR) status, as compared with patients with established RA and people in a healthy control group. We identified significant cell expansions in ARIs compared with controls, including CCR2+CD4+ T cells, T peripheral helper (Tph) cells, type 1 T helper cells, and CXCR5+CD8+ T cells. We also found that CD15+ classical monocytes were specifically expanded in ACPA-negative FDRs, and an activated PAX5lo naive B cell population was expanded in ACPA-positive FDRs. Further, we uncovered the molecular phenotype of the CCR2+CD4+ T cells, expressing high levels of Th17- and Th22-related signature transcripts including CCR6, IL23R, KLRB1, CD96, and IL22. Our integrated study provides a promising approach to identify targets to improve prevention strategy development for RA.

Keywords: Arthritis; Autoimmunity; Bioinformatics; Immunology; Rheumatology.


Figures

Figure 1
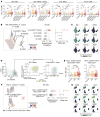
Figure 1. Overview of mass cytometry pipeline and cell type abundance analysis for at-risk individuals using all mononuclear cells.
(A) Description of study design regarding patient recruitment, clinical classification, and computational strategies. (B) Identified major immune cell types among all mononuclear cells and canonical protein expression in uniform manifold approximation and projection (UMAP). (C) At-risk individual (ARI) associations compared with controls for all mononuclear cells. P value was generated from covarying neighborhood analysis (CNA). Cells in UMAP are colored for expansion (red) or depletion (blue) in ARIs. For each cell type, distributions of ARI-associated cell neighborhood correlations and odds ratios with 95% confidence intervals are shown. All the ARI association testing was adjusted for age and sex.
Figure 2
Figure 2. Cell type–specific clustering analysis reveals 79 distinct cell states.
(AD) Cell type–specific immune proteomic reference colored by fine-grained cell states in the UMAP space. For each cell type, the heatmap shows the average expression distributions of key variable proteins in each cluster across samples, scaled within each cell cluster. Clusters are ordered by protein expression pattern using hierarchical clustering.
Figure 3
Figure 3. Identification of specific T cell populations that were associated with ARI.
(A) Distribution of frequencies of cell types identified as ARI-related cell types in B. *P < 0.05, **P < 0.01, ***P < 0.001, ****P < 0.0001 by 2-sided Wilcoxon’s test. (B) Left: Associations of T cell neighborhoods with ARIs versus controls. For all CNA-based association results, cells in UMAP are colored in red (expansion) or blue (depletion), and P value is shown as well. Distributions of cell neighborhood correlations (middle) and odds ratios (right) are shown. Error bars for odds ratios represent 95% confidence intervals. (C) Expression of selected surface proteins within T cells is colored from dark blue (low) to green (high). (D) Scatterplot of cell type abundance correlations across individuals. (E) Description of the validation dataset and analytical strategies, including reference mapping to the original T cell clusters, association test using CNA, and comparison of the proportion of expanded cells (neighborhood correlation > 0) in ARIs (vs. control) between 2 independent datasets by clusters. (F) Scatterplot of the proportion of expanded cells in ARIs by clusters, with x axis for the original T cell panel and y axis for the validation dataset. Red dots represent significant cell clusters in the original T cell panel. All statistical association tests were adjusted for age and sex. Correlation coefficients and P values were obtained from Spearman’s correlation test.
Figure 4
Figure 4. Identification of different myeloid cell populations that were associated with ARIs.
(A) Distribution of frequencies of cell types identified as ARI-related cell types in B. **P < 0.01, ***P < 0.001, ****P < 0.0001 by 2-sided Wilcoxon’s test. (B) Associations of myeloid cell neighborhoods with ARIs versus controls (left), distributions of cell neighborhood correlations (middle), and odds ratios (right) are shown. (C) Expression of selected surface proteins within myeloid cells is colored from dark blue (low) to green (high).
Figure 5
Figure 5. Identification of different B cell and NK cell populations that were associated with ARIs.
(A) Distribution of frequencies of cell types for B cell subsets that were identified as ARI-related cell types in B. *P < 0.05, **P < 0.01 by 2-sided Wilcoxon’s test. (B) Associations of B cell neighborhoods with ARIs versus controls (left), distributions of cell neighborhood correlations (middle), and odds ratios (right) are shown. (C) Expression of selected surface proteins within B cells. (D) Distributions of activation marker (CD21 and CD23) antibody staining in the conventional naive B cell cluster (B-0) and the PAX5lo naive B cell cluster (B-6). Low expression of CD21 and/or CD23 indicates activated B cells. (E) Distribution of frequencies of cell types for NK cell subsets that were identified as ARI-related cell types in F. **P < 0.01, ****P < 0.0001 by 2-sided Wilcoxon’s test. (F) Associations of NK cell neighborhoods with ARIs versus controls (left), distributions of cell neighborhood correlations (middle), and odds ratios (right) are shown. (G) Expression of selected surface proteins within NK cells. All the statistical association tests were adjusted for age and sex. For all CNA-based association results, cells in UMAP are colored in red (expansion) or blue (depletion), and P value is shown as well. Error bars for odds ratios represent 95% confidence intervals.
Figure 6
Figure 6. ACPA status–specific analysis reveals unique populations for different disease statuses for T cells.
Heatmap shows association with each ACPA status subgroup in ARIs and RA patients (vs. controls) for each cell type. Only clusters with P < 0.05 are shown. Circles represent P < 0.05, and squares represent adjusted P < 0.05. Adjusted P values were calculated by the Benjamini-Hochberg method. Cell types are colored in red (expanded) or blue (depleted). Error bars on selected cell populations represent 95% confidence intervals. All the results in this analysis were adjusted for age and sex.
Figure 7
Figure 7. Validation using CITE-Seq data and molecular phenotype of CCR2+CD4+ T cells.
(A) Composition and experimental design of CITE-Seq data, involving 69 participants with RA, 46 ARIs, and 25 controls. CITE-Seq includes single-cell RNA-Seq and antibody-derived tag (ADT) analysis to assess gene and protein expression. (B) Reference mapping assigned concordant cell clusters with mass cytometry data to CITE-Seq data. De novo cell clusters in CITE-Seq data are shown in the left UMAP plot. Through reference mapping using mass cytometry data as a reference, their cell cluster labels were transferred to the corresponding CITE-Seq clusters, effectively annotating the unidentified clusters with known cell types, as shown in the right plot. (C) UMAP plots of surface protein expression for key markers (CD3, CD4, CD8, CD56, CD20, CLEC12A) across PBMCs. Color intensity represents normalized expression levels of each marker, indicating presence and distribution of various cell populations. (D) UMAP plot of T cells from CITE-Seq data. CCR2+CD4+ T cells are labeled and colored in blue. Other colors correspond to cluster colors in Figure 2A. (E) UMAP plots depicting expression patterns of Th17- and Th22-related surface proteins. (F) Heatmap showing normalized expression levels of Th17- and Th22-related genes across helper T cell subsets. (G) UMAP colored by enrichment of Th22, Th17, and Tph gene signatures. (H) Associations of T cell neighborhoods with ARIs versus controls. For CNA-based association results, cells in UMAP are colored in red (expansion) or blue (depletion). (I) Distribution of cell type frequency for CCR2+CD4+ T cells. *P < 0.05, ***P < 0.001 by 2-sided Wilcoxon’s test. (J) UMAP plot of subclusters in CCR2+CD4+ T cells. (K) UMAP plots depicting expression of surface proteins for helper T cell subsets. (L) UMAP plots colored by enrichment of Th22, Th17, and Tph gene signatures. (M) Associations of CCR2+CD4+ T cell neighborhoods with ARIs versus controls. For all CNA-based association results, cells in UMAP are colored in red (expansion) or blue (depletion). (N) Distribution of cell type frequency for subclusters in CCR2+CD4+ T cells. **P < 0.01, ****P < 0.0001 by 2-sided Wilcoxon’s test. (O) Scatterplot showing correlation between ARI association obtained from CNA in H and mRNA expression level of CCR6.

Update of

References

    1. Gravallese EM, Firestein GS. Rheumatoid arthritis — common origins, divergent mechanisms. N Engl J Med. 2023;388(6):529–542. doi: 10.1056/NEJMra2103726. - DOI - PubMed
    1. Smolen JS, et al. Rheumatoid arthritis. Lancet. 2016;388(10055):2023–2038. doi: 10.1016/S0140-6736(16)30173-8. - DOI - PubMed
    1. van Steenbergen HW, et al. Preventing progression from arthralgia to arthritis: targeting the right patients. Nat Rev Rheumatol. 2018;14(1):32–41. doi: 10.1038/nrrheum.2017.185. - DOI - PMC - PubMed
    1. Kokkonen H, et al. Up-regulation of cytokines and chemokines predates the onset of rheumatoid arthritis. Arthritis Rheum. 2010;62(2):383–391. doi: 10.1002/art.27186. - DOI - PubMed
    1. Deane KD, et al. The number of elevated cytokines and chemokines in preclinical seropositive rheumatoid arthritis predicts time to diagnosis in an age-dependent manner. Arthritis Rheum. 2010;62(11):3161–3172. doi: 10.1002/art.27638. - DOI - PMC - PubMed

MeSH terms

Substances