. 2025 Feb 28:13:1543882.
doi: 10.3389/fbioe.2025.1543882. eCollection 2025.

Batch-fabricated full glassy carbon fibers for real-time tonic and phasic dopamine detection

Affiliations

Batch-fabricated full glassy carbon fibers for real-time tonic and phasic dopamine detection

Umisha Siwakoti et al. Front Bioeng Biotechnol. .

Abstract

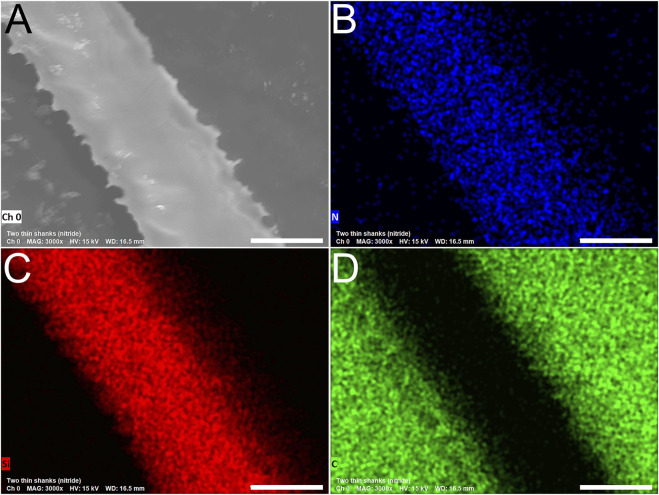
Dopamine (DA) is a critical neurotransmitter that is key in regulating motor functions, motivation, and reward-related behavior. Measuring both tonic (baseline, steady-state) and phasic (rapid, burst-like) DA release is essential for elucidating the mechanisms underlying neurological disorders, such as schizophrenia and Parkinson's disease, which are associated with dysregulated tonic and phasic DA signaling. Carbon fiber microelectrodes (CFEs) are considered the gold standard for measuring rapid neurotransmitter changes due to their small size (5-10 µm), biocompatibility, flexibility, and excellent electrochemical properties. However, achieving consistent results and large-scale production of CFE arrays through manual fabrication poses significant challenges. We previously developed flexible glassy carbon (GC) microelectrode arrays (MEAs) and GC fiber-like MEAs (GCF MEAs) for neurotransmitter detection and electrophysiology recording. We also demonstrated the feasibility of fabricating GC MEA with both GC electrodes and interconnects made from a single homogeneous material, eliminating the need for metal interconnections and addressing related concerns about electrical and mechanical stability under prolonged electrochemical cycling. Building on our prior experience, we now present a double-etching microfabrication technique for the batch production of 10 μm × 10 µm full GC fibers (fGCFs) and fGCF arrays, composed entirely of homogeneous GC material. This process uses a 2 µm-thick low-stress silicon nitride as the bottom insulator layer for the fGCFs. The effectiveness of the fabrication process was validated through scanning electron microscophy (SEM) and energy dispersive X-ray spectroscopy (EDS) elemental analyses, which confirmed the uniformity of the Si₃N₄ insulation layer and ensured the overall integrity of the fGCFs. Using finite element analysis, we optimized the fGCF form factor to achieve self-penetration up to 3 mm into the mouse striatum without additional support. The electrochemical characterization of fGCFs demonstrated high electrical conductivity and a wide electrochemical window. The ability of fGCFs to detect phasic and tonic DA release was confirmed using fast scan cyclic voltammetry (FSCV) and square wave voltammetry (SWV), respectively, both in vitro and in vivo. With their high sensitivity for phasic and tonic DA detection, combined with a scalable fabrication process and self-supporting insertion capability, fGCFs are promising sensors that offer enhanced practicality for comprehensive DA monitoring.

Keywords: dopamine; fast scan cyclic voltammetry (FSCV); glassy carbon fibers; microelectrodes; square wave voltammetry (SWV).


Conflict of interest statement

The authors declare that the research was conducted in the absence of any commercial or financial relationships that could be construed as a potential conflict of interest. The author(s) declared that they were an editorial board member of Frontiers, at the time of submission. This had no impact on the peer review process and the final decision.

Figures

SCHEME 1
SCHEME 1
SU-8 3035 spin-coating and (2.) patterning of full glassy carbon fiber (fGCF) on Si3N4 wafer; (3.) pyrolysis; (4.) spin-coating and photolithographic patterning of the SU-8 3010 insulation layer on top of the GCF; (5.) spin-coating and photolithographic patterning of positive photoresist S1813 (protective sacrificial layer); (6.) CF4 reactive ion etching (RIE) of the unprotected Si3N4; (7.) pure chemical isotropic XeF2 etching of the exposed Si substrate to release the devices; and (8.) removal of the remaining sacrificial protective layer with acetone after the fGCF release.
FIGURE 1
FIGURE 1
Finite element simulation demonstrating (A) buckling of the uninsulated GCF and (B) straight insertion of silicon nitride insulated GCF at 1 mm, 2 mm, and 3 mm insertion depths. The color scale shows the lateral displacement in Y direction of the ZY view of the snapshots.
FIGURE 2
FIGURE 2
SEM image (A) and elemental analysis (B–D) of the surface of fGCF release using isotropic XeF2 etching (side insulated with Si3N4). Elemental analyses conducted using energy dispersive X-ray spectroscopy (EDS) confirmed a consistent and uniform presence of N [in blue, (B)] and Si [in red, (C)] along the fGCF and the presence of carbon in the areas where the focus of the analysis was on the carbon tape of the stub [green, (D)], where the fGCF is positioned for imaging. Scale bar is 9 µm.
FIGURE 3
FIGURE 3
(A) Optical picture of fGCF (10 µm wide, 10 µm thick); (B) Representative example of a cyclic voltammetry plot of fGCF; (C) Electrochemical impedance spectra of the magnitude impedance of fGCFs (mean and SD, n = 5); (D) Optical picture of fGCF array with six GCFs at 170 μm each; (E) Batch fabricated fGCF and fGCF arrays in a Si3N4 coated 4 in wafer before being released; (F) Optical picture of fGCF in a Si3N4 coated wafer; (G) Raman Spectrum of GC; (H) Optical picture of a released fGCF array.
FIGURE 4
FIGURE 4
(A) In vitro FSCV calibration plot of fGCFs conducted in 1xPBS in the DA concentration range of 0.25 μM - 2 μM (peak current vs. DA concentration, mean and SD; n = 5), (B) Color plot and background subtracted FSCV plot (inset, in white) corresponding to 250 nM DA concentration; (C) In vitro SWV DA calibration plot (Peak current vs. DA concentration, mean and SD, n = 5) obtained from fGCF conducted in 1x PBS in 50 nM -1,000 nM concentration range and (D) corresponding baseline subtracted SWV DA peaks. Representative SWV without baseline subtraction are reported in Supplementary Figure S3.
FIGURE 5
FIGURE 5
In vivo validation. (A, B) In vivo baseline subtracted SWV of (A) tonic DA peak before (average and standard deviation, n = 3 mice; the recording, for each mouse, corresponds to SWV measurements collected over 20-min recordings) and (B) 15 min (blue) and 30 min (red) post-administration of a cocktail of 2 mg/kg raclopride (RAC) and 20 mg/kg nomifensine (NOM). (C) In vivo FSCV color plot corresponding to DA release evoked by electrical stimulation of DA axons in the MFB; and (D) corresponding time/current plot. Red arrow shows when the stimulation started. (E) Optical picture of fGCF explanted from the brain.
FIGURE 6
FIGURE 6
Histological analysis of the tissue surrounding the fGCF after 1 week. Images show the electrode tracks from two different implants (GCF1 and GCF2) at a depth of Z1 = -1,225 and Z2 = -1,325 µm, respectively stained for (A) Caspase (green), (B) NeuN (red), (C) IgG (gray), and (D) merged including DAPI in blue. Scale bar is 100 µm.

References

    1. Arana L. R., de Mas N., Schmidt R., Franz A. J., Schmidt M. A., Jensen K. F. (2007). Isotropic etching of silicon in fluorine gas for MEMS micromachining. J. Micromechanics Microengineering 17 (2), 384–392. 10.1088/0960-1317/17/2/026 - DOI
    1. Arias-Carrión Ó., Pöppel E. (2007). Dopamine, learning, and reward-seeking behavior. Acta neurobiol. Exp. 67 (4), 481–488. 10.55782/ane-2007-1664 - DOI - PubMed
    1. Atcherley C. W., Laude N. D., Parent K. L., Heien M. L. (2013). Fast-scan controlled-adsorption voltammetry for the quantification of absolute concentrations and adsorption dynamics. Langmuir 29 (48), 14885–14892. 10.1021/la402686s - DOI - PubMed
    1. Atcherley C. W., Wood K. M., Parent K. L., Hashemi P., Heien M. L. (2015). The coaction of tonic and phasic dopamine dynamics. Chem. Commun. 51 (12), 2235–2238. 10.1039/c4cc06165a - DOI - PMC - PubMed
    1. Baik J.-H. (2013). Dopamine signaling in reward-related behaviors. Front. neural circuits 7, 152. 10.3389/fncir.2013.00152 - DOI - PMC - PubMed

LinkOut - more resources