

Development and validation of an explainable machine learning model to predict Delphian lymph node metastasis in papillary thyroid cancer: a large cohort study
- PMID: 40092685
- PMCID: PMC11905415
- DOI: 10.7150/jca.110141
Development and validation of an explainable machine learning model to predict Delphian lymph node metastasis in papillary thyroid cancer: a large cohort study
Abstract
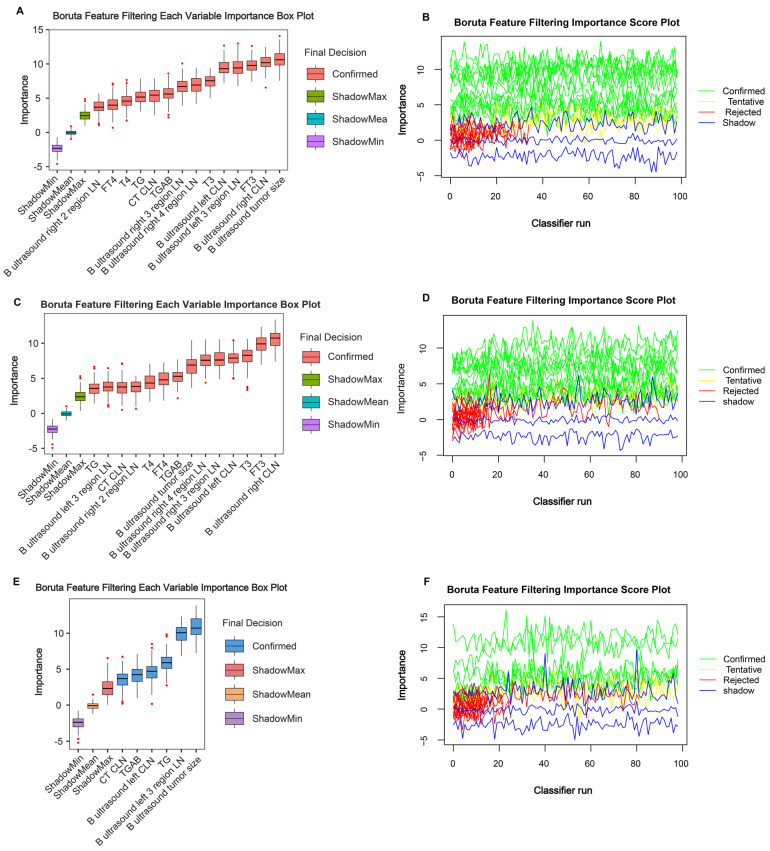
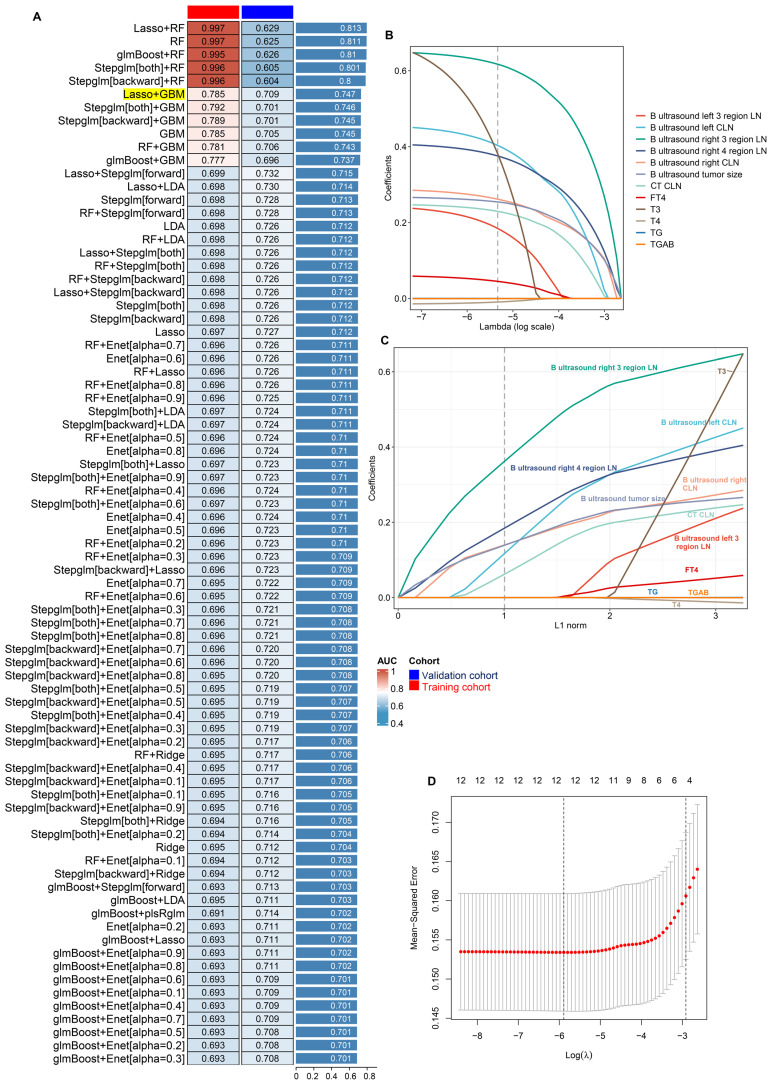
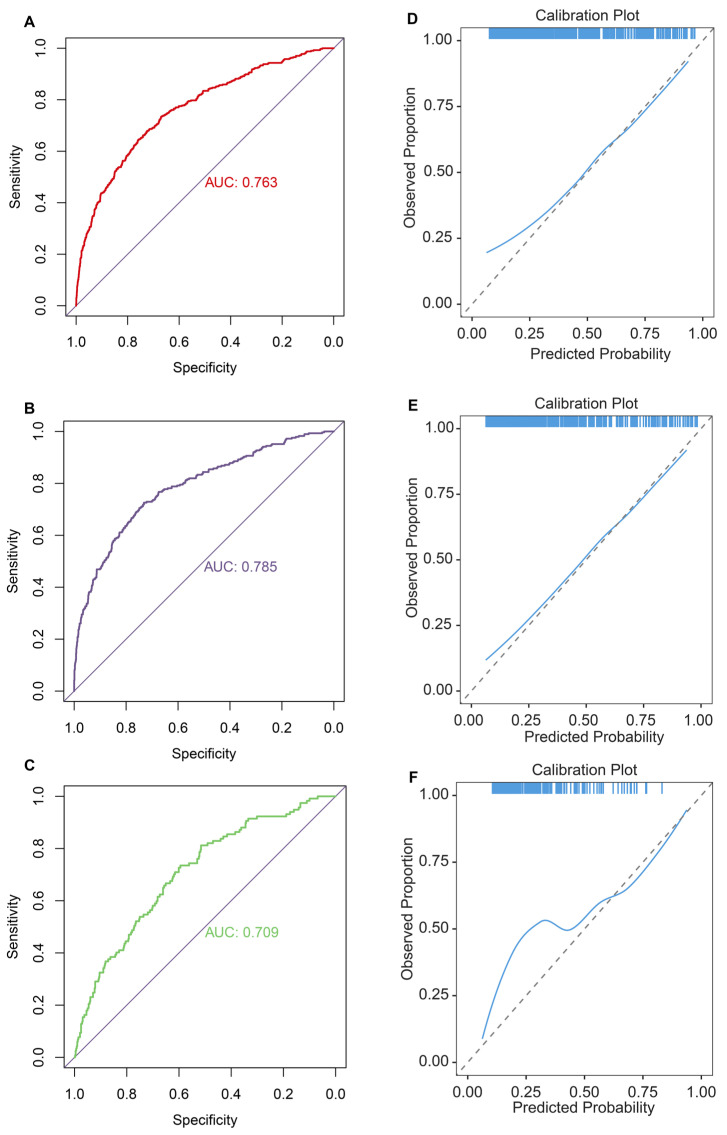
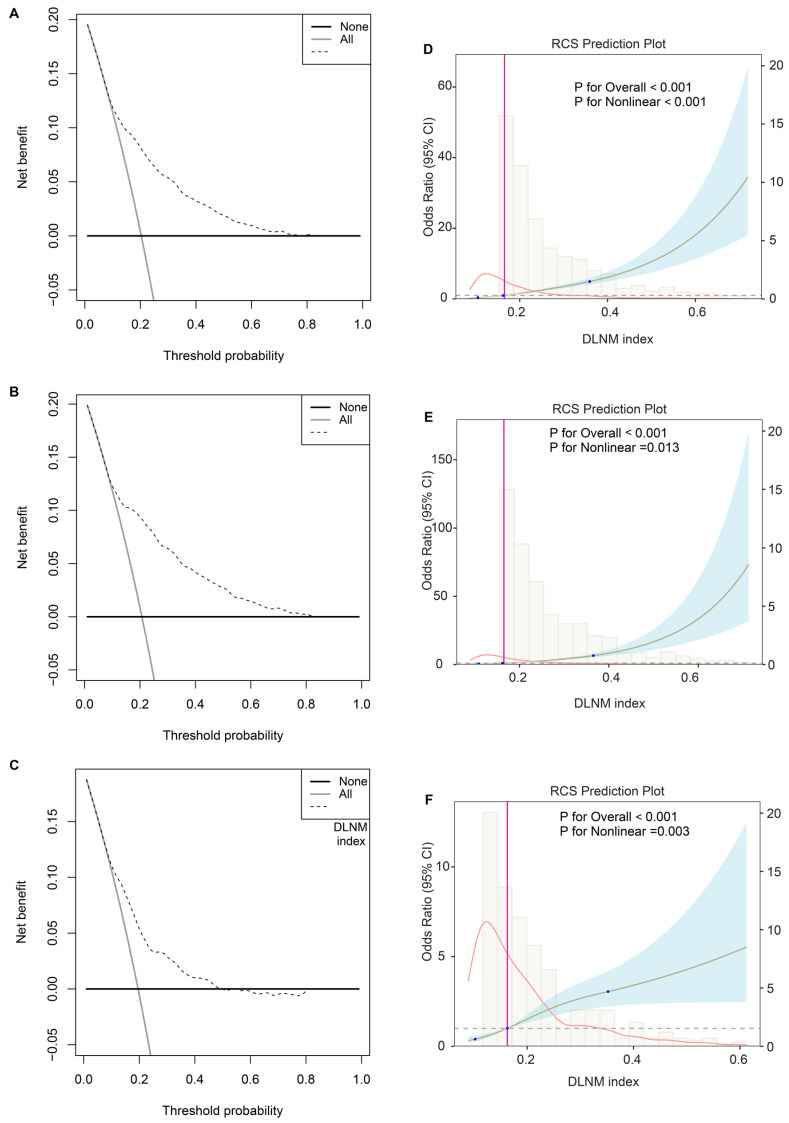
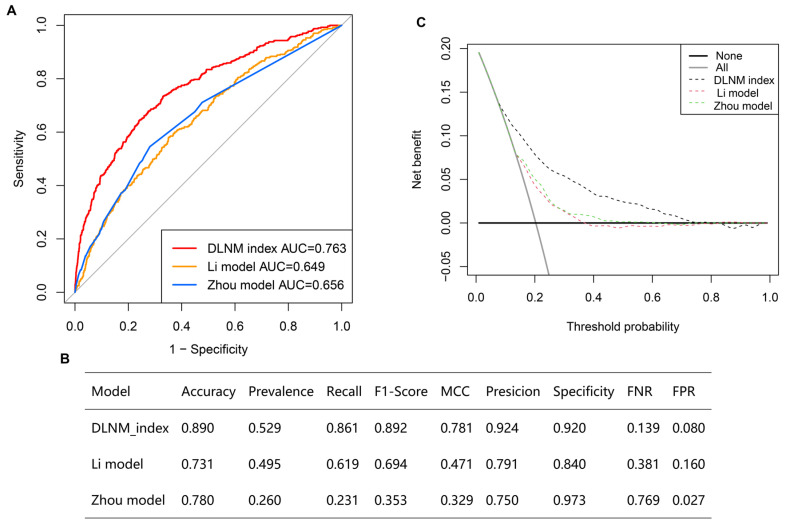
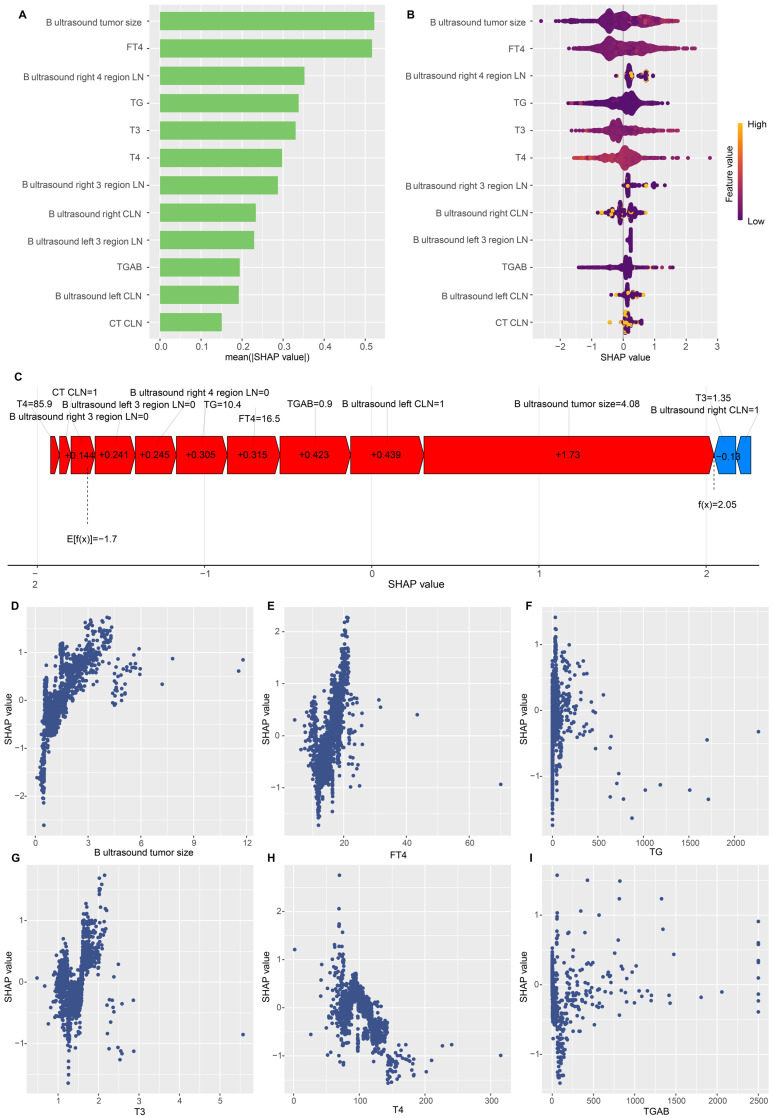
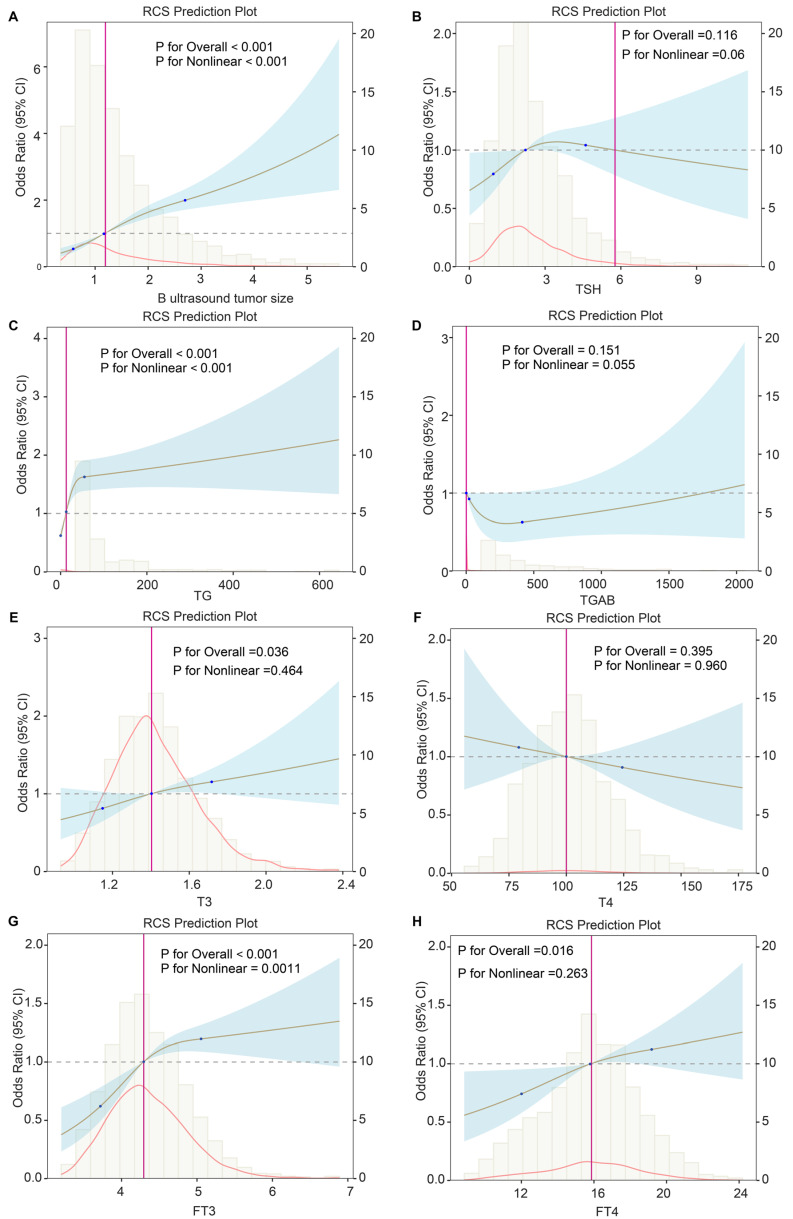
Background: The occurrence of papillary thyroid cancer (PTC) has risen substantially and tends to exhibit early-stage lymph node metastasis (LNM), increasing the risk of postoperative recurrence and decreasing survival. There is a lack of a machine learning (ML) model to predict delphian LNM (DLNM) in PTC. This investigation seeks to comprehensively assess the significance of standard clinical indicators for DLNM prediction, while constructing a dependable and widely applicable ensemble ML framework to support surgical planning and therapeutic decision-making. Methods: This investigation incorporated 1993 sequential PTC patients who underwent curative surgical procedures from 2020 to 2023. Based on the time to surgery, we divided the cohort into the training cohort (n=1395) and the validation cohort (n=598). The Boruta algorithm was applied to select feature variables, succeeded by the development of an innovative ML structure combining 12 ML techniques across 113 permutations to create a unified prediction model (DLNM index). ROC analysis, calibration curve, Bootstrapping, 10-fold cross validation, restricted cubic spline (RCS) regression, multivariable logistic regression, and subgroup analysis were utilised to evaluate the predictive accuracy and discriminative ability of the DLNM index. Model interpretation and feature impact visualisation were accomplished through the Shapley Additive Explanations (SHAP) methodology. Results: Based on 14 features via the Boruta algorithm selection, we integrated them into 12 ML approaches, yielding 113 permutations, from which we identified the superior algorithm to establish a consensus ML-derived diagnostic model (DLNM index). The DLNM index exhibited excellent diagnostic values with a mean AUC of 0.763 in two cohorts and discriminative ability, serving as an independent risk factor (P < 0.001). It performed better in predicting performance and yielded a larger net benefit than the published model (P < 0.05). Bootstrapping and 10-fold cross validation, and subgroup analysis showed that the DLNM index was generally robust and generalisable. SHAP explains the importance of ranking features (tumour size, right 4 region LN, FT4, TG, and T3) and visualises global and individual risk prediction. RCS regression suggested a nonlinear link between the DLNM index, TG, tumour size, FT3, and DLNM risk. Conclusion: An optimised explainable model (DLNM index) comprising 12 clinical features based on multiple ML algorithms was constructed and validated to provide an economical, readily available, and precise diagnostic instrument for DLNM in PTC, which has potential implications for clinical practice. The SHAP explanation and RCS regression quantify and visualise tumour size and FT4 as the most important variables that increase DLNM risk.
Keywords: delphian lymph node metastasis; machine learning approaches; model interpretability; papillary thyroid cancer; prediction model.
© The author(s).
Conflict of interest statement
Competing Interests: The authors have declared that no competing interest exists.
Figures
Similar articles
-
Preoperative US Integrated Random Forest Model for Predicting Delphian Lymph Node Metastasis in Patients with Papillary Thyroid Cancer.Curr Med Imaging. 2023;19(9):1031-1040. doi: 10.2174/1573405619666230105150219. Curr Med Imaging. 2023. PMID: 36606588
-
Prediction of lateral lymph node metastasis with short diameter less than 8 mm in papillary thyroid carcinoma based on radiomics.Cancer Imaging. 2024 Nov 15;24(1):155. doi: 10.1186/s40644-024-00803-7. Cancer Imaging. 2024. PMID: 39548590 Free PMC article.
-
Nomograms Combining Ultrasonic Features With Clinical and Pathological Features for Estimation of Delphian Lymph Node Metastasis Risk in Papillary Thyroid Carcinoma.Front Oncol. 2021 Dec 23;11:792347. doi: 10.3389/fonc.2021.792347. eCollection 2021. Front Oncol. 2021. PMID: 35004316 Free PMC article.
-
Meta-analysis of the effect and clinical significance of Delphian lymph node metastasis in papillary thyroid cancer.Front Endocrinol (Lausanne). 2024 Jan 19;14:1295548. doi: 10.3389/fendo.2023.1295548. eCollection 2023. Front Endocrinol (Lausanne). 2024. PMID: 38313842 Free PMC article.
-
Meta-analysis of prediction models for predicting lymph node metastasis in thyroid cancer.World J Surg Oncol. 2024 Oct 22;22(1):278. doi: 10.1186/s12957-024-03566-4. World J Surg Oncol. 2024. PMID: 39438906 Free PMC article.
References
-
- Siegel RL, Miller KD, Wagle NS, Jemal A. Cancer statistics, 2023. CA Cancer J Clin. 2023;73(1):17–48. - PubMed
-
- Miller KD, Fidler-Benaoudia M, Keegan TH, Hipp HS, Jemal A, Siegel RL. Cancer statistics for adolescents and young adults, 2020. CA Cancer J Clin. 2020;70(6):443–459. - PubMed
-
- Haugen BR, Alexander EK, Bible KC. et al. 2015 American Thyroid Association Management Guidelines for Adult Patients with Thyroid Nodules and Differentiated Thyroid Cancer: The American Thyroid Association Guidelines Task Force on Thyroid Nodules and Differentiated Thyroid Cancer. Thyroid. 2016;26(1):1–133. - PMC - PubMed
-
- So YK, Kim MJ, Kim S, Son YI. Lateral lymph node metastasis in papillary thyroid carcinoma: A systematic review and meta-analysis for prevalence, risk factors, and location. Int J Surg. 2018;50:94–103. - PubMed
LinkOut - more resources
Full Text Sources
Miscellaneous
