[Preprint]. 2024 Oct 1:2024.09.29.615708.
doi: 10.1101/2024.09.29.615708.

Topographic organization of bidirectional connections between the cingulate region (infralimbic area and anterior cingulate area, dorsal part) and the interbrain (diencephalon) of the adult male rat

Affiliations

Topographic organization of bidirectional connections between the cingulate region (infralimbic area and anterior cingulate area, dorsal part) and the interbrain (diencephalon) of the adult male rat

Kenichiro Negishi et al. bioRxiv. .

Abstract

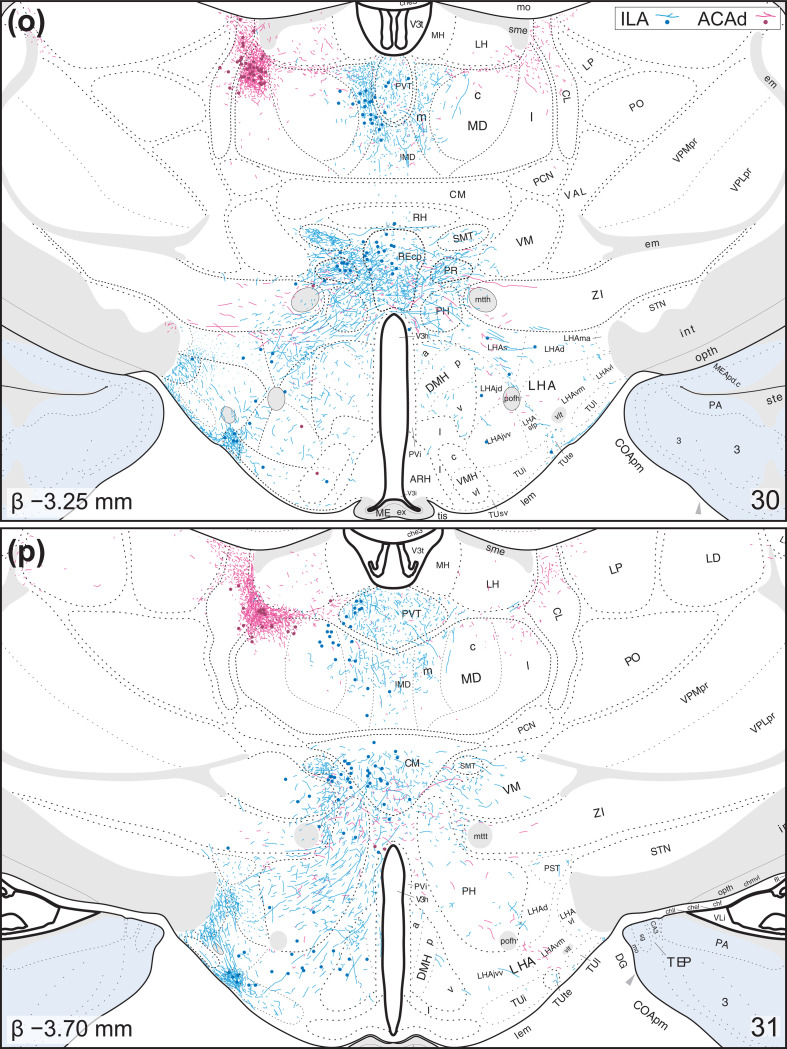
The medial prefrontal cortex [cingulate region (Brodmann, 1909) (CNG)] in the rat is a connectionally and functionally diverse structure. It harbors cerebral nuclei that use long-range connections to promote adaptive changes to ongoing behaviors. The CNG is often described across functional and anatomical gradients, a dorsalventral gradient being the most prominent. Topographic organization is a general feature of the nervous system, and it is becoming clear that such spatial arrangements can reflect connectional, functional, and cellular differences. Portions of the CNG are known to form reciprocal connections with cortical areas and thalamus; however, these connectional features have not been described in detail or mapped to standardized rat brain atlases. Here, we used co-injected anterograde (Phaseolus vulgaris leucoagglutinin) and retrograde (cholera toxin B subunit) tracers throughout the CNG to identify zones of reciprocal connectivity in the diencephalon [or interbrain (Baer, 1837) (IB)]. Tracer distributions were observed using a Nissl-based atlas-mapping approach that facilitates description of topographic organization. This draft report describes CNG connections of the infralimbic area (Rose & Woolsey, 1948) (ILA) and the anterior cingulate area, dorsal part (Krettek & Price, 1977) (ACAd) throughout the IB. We found that corticothalamic connections are predominantly reciprocal, and that ILA and ACAd connections tended to be spatially segregated with minimal overlap. In the hypothalamus (Kuhlenbeck, 1927), we found dense and specific ILA-originating terminals in the following Brain Maps 4.0 atlas territories: dorsal region (Swanson, 2004) (LHAd) and suprafornical region (Swanson, 2004) (LHAs) of the lateral hypothalamic area (Nissl, 1913), parasubthalamic nucleus (Wang & Zhang, 1995) (PSTN), tuberal nucleus, terete part (Petrovich et al., 2001) (TUte), and an ill-defined dorsal cap of the medial mammillary nucleus (Gudden, 1881) (MM). We discuss these findings in the context of feeding behaviors.

Keywords: anterograde; brain atlas; feeding; lateral hypothalamic area; mapping; prefrontal cortex; retrograde.


Conflict of interest statement

Conflicts of Interest: The authors declare no conflict of interest. The funders had no role in the design of the study; in the collection, analyses, or interpretation of data; in the writing of the manuscript, or in the decision to publish the results.

Figures

Figure 1.
Figure 1.. Maps showing PHAL and CTB injection sites in the cingulate region (Brodmann, 1909) (CNG).
Each experiment is coded with a unique color, with PHAL-ir cells shown as circles and CTB injection spread represented with contours. The scales on the edges indicate mediolateral (top), dorsoventral (right), and anteroposterior (bottom) dimensions based on atlas levels from Brain Maps 4.0 (BM4.0; Swanson, 2018). See the list of abbreviations on page 35 for their explanation.
Figure 2.
Figure 2.. Photomicrographs showing the centers of PHAL and CTB injections into the ILA and ACAd.
Regional boundaries derived from adjacent Nissl-stained sections (middle column) were superimposed on immunostained images of PHAL (left column) and CTB (right column). Immunostained images shown here for ACAd and ILA were visualized with epifluorescence and DAB reactions, respectively. Scale bars: 500 μm. See the list of abbreviations on p. 35 for an explanation of those shown in this figure.
Figure 3.
Figure 3.. Representative maps showing distributions of immunoreactive PHAL and CTB throughout the diencephalon.
Color-coded tracers from ACAd (purple) and ILA (blue) were localized using boundaries deduced from Nissl-stained sections. Dots mark cell bodies, lines mark axonal fibers. Inferred anterior-posterior positions, indicated as bregma values in the lower-left corners, were derived from BM4.0 (Swanson, 2018). Atlas levels from BM4.0 are indicated in the lower-right corners. See the list of abbreviations on p. 35 for an explanation of the abbreviations shown in this figure.
Figure 4.
Figure 4.. Photomicrographs of PHAL-immunoreactive (-ir) axons from the ILA (experiment # 15–113) in the dorsal (Swanson, 2004) (LHAd) and suprafornical (Swanson, 2004) (LHAs) regions of the lateral hypothalamic area (Nissl, 1913).
(a) Adjacent Nissl-stained section with boundaries and terminology based on Swanson (2018). (b) Darkfield photomicrograph showing PHAL-ir axons. Spatial alignment, labels, and scale bar were derived from the reference Nissl-stained section in (a). Scale bar: 500 μm. See the list of abbreviations on p. 35 for an explanation of the abbreviations shown in this figure.
Figure 5.
Figure 5.. Photomicrographs of PHAL-immunoreactive (-ir) axons from the ILA (experiment # 15–113) in the terete part (Petrovich et al., 2001) (TUte) of the tuberal nucleus (>1840) (a, b), the parasubthalamic nucleus (Wang & Zhang, 1995) (PSTN) and median part (>1840) (MMme) of the medial mammillary nucleus (Gudden, 1881) (c, d).
Adjacent Nissl-stained sections showing the TUte (a) and PSTN (c). Boundaries and terminology were based on Swanson (2018) and superimposed on darkfield photomicrographs showing PHAL-ir axons in the TUte (b), PSTN and MMme (d). Scale bars: 200 μm in (a); 500 μm in (c). See the list of abbreviations on p. 35 for an explanation of the abbreviations shown in this figure.
Figure 6.
Figure 6.. Photomicrographs showing ACAd axons (experiment #15–131) in rostral thalamus (His, 1893) and the formation of putative monosynaptic reciprocal connectivity in the central medial thalamic nucleus (Rioch, 1929) (CM).
(a) Adjacent Nissl-stained photomicrograph showing superimposed boundaries and regional terms based on Swanson (2018). (b) Darkfield photomicrographs showing immunoreactive (-ir) labeling in the CM, mediodorsal (>1840) and anteromedial (>1840) thalamic nuclei based on the Nissl stain in (a). (c) Extended-focus image showing PHAL-ir axons (black) and CTB-ir neurons (brown) in the CM captured with ×100 objective lenses. (d, e, f) Mosaics made with single z-plane images to show putative appositions (blue arrowheads) from regions indicated in (c). Scale bars: 500 μm in (a) and (b); 50 μm in (c); 10 μm in (d); 20 μm in (e) and (f). See the list of abbreviations on p. 35 for an explanation of the abbreviations shown in this figure.
Figure 7.
Figure 7.. Photomicrographs showing ACAd axon terminals (experiment #15–131) in a rostromedial part of the ventral medial thalamic nucleus (>1840) (VM), and not the zona incerta (>1840) (ZI).
(a) Adjacent Nissl-stained photomicrograph showing superimposed boundaries and regional terms based on Swanson (2018). (b) Darkfield photomicrographs showing immunoreactive (-ir) labeling in the VM immediately ventral to the thalamic mammillothalamic tract (Swanson, 2015) (mttt). Asterisks and arrowheads in (a) and (b) show common vasculature between both sections. (c) Extended-focus image showing PHAL-ir axons (black) and CTB-ir neurons (brown) in the VM captured with ×100 objective lenses. (d, e) Mosaics made with single z-plane images to show putative appositions (blue arrowheads) on neurons indicated with arrows in (c). Scale bars: 200 μm in (a) and (b); 100 μm in (c); 10 μm in (d) and (e). See the list of abbreviations on p. 35 for an explanation of the abbreviations shown in this figure.

References

    1. Abrahamson E. E., & Moore R. Y. (2001). The posterior hypothalamic area: chemoarchitecture and afferent connections. Brain Res, 889(1–2), 1–20. 10.1016/s0006-8993(00)03015-8 - DOI - PubMed
    1. Akhter F., Haque T., Sato F., Kato T., Ohara H., Fujio T., Tsutsumi K., Uchino K., Sessle B. J., & Yoshida A. (2014). Projections from the dorsal peduncular cortex to the trigeminal subnucleus caudalis (medullary dorsal horn) and other lower brainstem areas in rats. Neuroscience, 266, 23–37. 10.1016/j.neuroscience.2014.01.046 - DOI - PubMed
    1. Alcaraz F., Marchand A. R., Courtand G., Coutureau E., & Wolff M. (2016). Parallel inputs from the mediodorsal thalamus to the prefrontal cortex in the rat. Eur J Neurosci, 44(3), 1972–1986. 10.1111/ejn.13316 - DOI - PubMed
    1. Alexander G. E., Crutcher M. D., & DeLong M. R. (1990). Basal ganglia-thalamocortical circuits: parallel substrates for motor, oculomotor, “prefrontal” and “limbic” functions. Prog Brain Res, 85, 119–146. 10.1016/S0079-6123(08)62678-3 - DOI - PubMed
    1. Allen G. V., & Hopkins D. A. (1989). Mamillary body in the rat: topography and synaptology of projections from the subicular complex, prefrontal cortex, and midbrain tegmentum. J Comp Neurol, 286(3), 311–336. 10.1002/cne.902860303 - DOI - PubMed

Publication types