[Preprint]. 2025 Mar 5:2025.03.03.641286.
doi: 10.1101/2025.03.03.641286.

Caloric restriction reprograms adipose tissues in rhesus monkeys

Affiliations

Caloric restriction reprograms adipose tissues in rhesus monkeys

Josef P Clark et al. bioRxiv. .

Update in

Abstract

Caloric restriction (CR) is a dietary intervention that delays the onset of age-related diseases and enhances survival in diverse organisms, and although changes in adipose tissues have been implicated in the beneficial effects of CR the molecular details are unknown. Here we show shared and depot-specific adaptations to life-long CR in subcutaneous and visceral adipose depots taken from advanced age male rhesus monkeys. Differential gene expression and pathway analysis identified key differences between the depots in metabolic, immune, and inflammatory pathways. In response to CR, RNA processing and proteostasis-related pathways were enriched in both depots but changes in metabolic, growth, and inflammatory pathways were depot-specific. Commonalities and differences that distinguish adipose depots are shared among monkeys and humans and the response to CR is highly conserved. These data reveal depot-specificity in adipose tissue adaptation that likely reflects differences in function and contribution to age-related disease vulnerability.

Keywords: adipose; caloric restriction; rhesus monkeys; subcutaneous; visceral.


Conflict of interest statement

Conflict of Interest The authors declare no conflict of interest.

Figures

Figure 1:
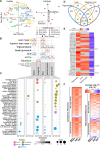
Figure 1:. Transcriptional signatures of individual-matched SAT and VAT in rhesus monkeys.
(A) MA-like plot depicting Log2 mean expression of genes between the two depots in the Control individuals. Genes differentially expressed (adjusted p<0.05) are highlighted for SAT (yellow) and VAT (blue). Inset heat maps depict the top and bottom 20% of DE genes (Log2FC SAT/VAT) for both depots. (B) Dot plot depicting KEGG pathway enrichment via GSEA (qvalue<0.1) for SAT (top) and VAT (bottom).
Figure 2:
Figure 2:. SAT and VAT elicit unique transcriptional responses to CR.
MA-plots of genes differentially expressed between CR and Control (C) diets in both depots. Log2 fold change is plotted against the average log2 expression for each gene. Genes differentially expressed are highlighted for each comparison (A) both depots (red/blue), (B) SAT (yellow), and (C) VAT (blue). (D) Heatmaps of the CR/C log2FC for the top 25% of most significant DE genes by the absolute value of the log2FC for both depots (shown for each comparison − 30 genes). Heatmaps of the CR/C log2FC for adipokines (E) and SenNet factors (F). Filled dot denotes passing adjusted p<0.05, empty dot denotes unadjusted p<0.05. (G) xCell transcriptome analysis identifying enrichment of individual cell types within each depot on the respective diets (* p<0.05 by Student’s t-test).
Figure 3:
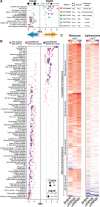
Figure 3:. CR induces common and adipose depot-specific pathways.
(A) Dot plot of KEGG pathways enriched via GSEA (qvalue <0.05) between CR and Control individuals (CR/C) for both depots, SAT, and VAT. (B) Rank-order plots of transcript expression by rank against the average log2 fold change between CR and Control diets. Genes where multiple isoforms are detected are denoted for both depots (red/blue), SAT (yellow), and VAT (blue). (C) Bar plots showing the number of genes and corresponding exons (passing adjusted p<0.1) that present exon-switching by DEX-seq analysis in response to CR for both SAT and VAT. (D) Dot plot of KEGG pathways enriched via ORA (unadjusted p<0.05, gene count > 2) for genes with exon-switching from SAT in (C). (E) Dot plot of KEGG pathways enriched via ORA (qvalue<0.05) for top-spliced genes (unadjusted p<0.05) in SAT.
Figure 4:
Figure 4:. Integrated adipose tissue response to CR.
(A) Multiple factor analysis of biometric indices: body weight, fat and lean mass, percent fat, appendicular lean mass, percent abdominal fat, HOMA-IR, glycosylated hemoglobin (Glyc HGB), basal glucose, basal insulin, insulin sensitivity (Si), cholesterol, triglycerides, white and red blood cell counts (WBC and RBC), hemoglobin (Hgb), hematocrit (Hct), blood urea nitrogen (BUN), creatinine, lactate dehydrogenase (LDH), gamma-glytamyl transferase (GGT), alanine aminotransferase (ALT), aspartate aminotransferase (AST), alkaline phosphatase (ALP), total protein, albumin, and total bilirubin. Variables correlation plot represents the relationship between each variable and the first two principal components (left), and individuals plot represents the principal component scores for both the Control and CR individuals (right). (B) Selected module-trait associations depicting correlations (top number) and pvalue (bottom number). (C) Dot plot of KEGG pathways enriched via ORA (qvalue<0.01) for genes contained within each module. (D) Venn diagram depicting the overlap of genes significantly associated (p<0.05) with each trait. (E) Heatmap of the gene significance (correlation between the gene and the trait) for the KEGG oxidative phosphorylation genes significantly associated (p<0.05) with each trait. (F) Heatmap of the Log2FC (CR/C) for the genes contained in the KEGG ribosome pathway for both depots, SAT and VAT.
Figure 5:
Figure 5:. Conservation of adipose tissue profiles and response to CR.
(A) Dot plot of KEGG pathways enriched via GSEA for NHP (this dataset; SAT/VAT) and human (various GSE datasets; SAT/VAT). The list contains NHP pathways passing qvalue<0.05. (B) Dot plot of KEGG pathways enriched via GSEA for NHP SAT (this dataset; CR/C) and human SAT (CALERIE dataset; 12mo/baseline or 24mo/baseline). The list contains at least one comparison with pathway passing qvalue<0.05. (C) Heatmap of the Log2FC for the genes contained in the KEGG ribosome and spliceosome pathway for NHP SAT (this dataset; CR/C) and human SAT (CALERIE dataset; 12mo/baseline or 24mo/baseline).

References

    1. Balasubramanian P., Howell P. R. & Anderson R. M. Aging and Caloric Restriction Research: A Biological Perspective With Translational Potential. EBioMedicine 21, 37–44 (2017). - PMC - PubMed
    1. Balasubramanian P., Mattison J. A. & Anderson R. M. Nutrition, metabolism, and targeting aging in nonhuman primates. Ageing Res. Rev. 39, 29–35 (2017). - PMC - PubMed
    1. Mattison J. A. et al. Caloric restriction improves health and survival of rhesus monkeys. Nat. Commun. 8, 14063 (2017). - PMC - PubMed
    1. Das S. K. et al. Body-composition changes in the Comprehensive Assessment of Long-term Effects of Reducing Intake of Energy (CALERIE)-2 study: a 2-y randomized controlled trial of calorie restriction in nonobese humans. Am. J. Clin. Nutr. 105, 913–927 (2017). - PMC - PubMed
    1. Kraus W. E. et al. 2 years of calorie restriction and cardiometabolic risk (CALERIE): exploratory outcomes of a multicentre, phase 2, randomised controlled trial. Lancet Diabetes Endocrinol. 7, 673–683 (2019). - PMC - PubMed

Publication types

LinkOut - more resources