[Preprint]. 2025 Mar 7:2025.03.02.641041.
doi: 10.1101/2025.03.02.641041.

TBCK-deficiency leads to compartment-specific mRNA and lysosomal trafficking defects in patient-derived neurons

Affiliations

TBCK-deficiency leads to compartment-specific mRNA and lysosomal trafficking defects in patient-derived neurons

Marco Flores-Mendez et al. bioRxiv. .

Abstract

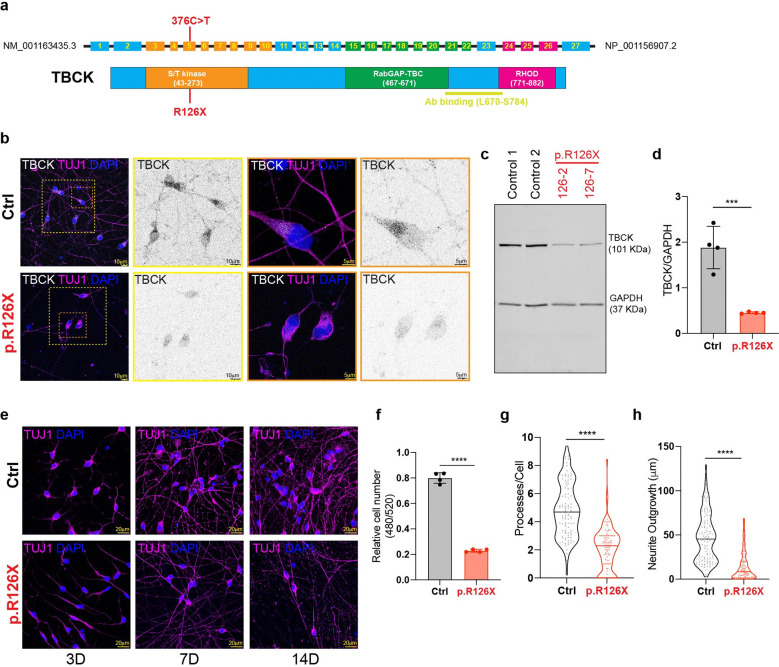
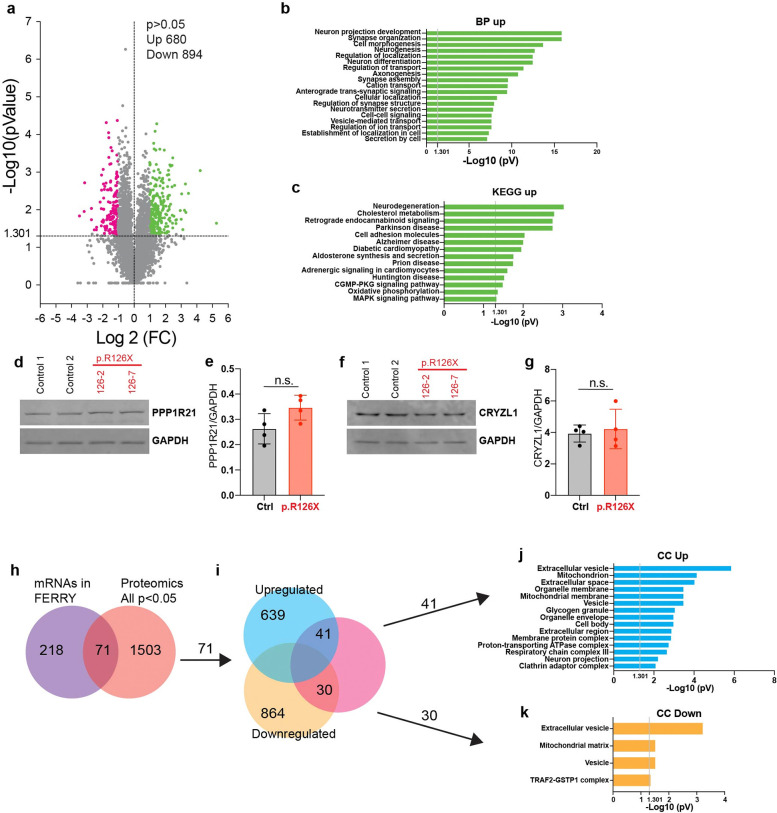
Monogenic pediatric neurodegenerative disorders can reveal fundamental cellular mechanisms that underlie selective neuronal vulnerability. TBCK-Encephaloneuronopathy (TBCKE) is a rare autosomal recessive disorder caused by stop-gain variants in the TBCK gene. Clinically, patients show evidence of profound neurodevelopmental delays, but also symptoms of progressive encephalopathy and motor neuron disease. Yet, the physiological role of TBCK protein remains unclear. We report a human neuronal TBCKE model, derived from iPSCs homozygous for the Boricua variant (p.R126X). Using unbiased proteomic analyses of human neurons, we find TBCK interacts with PPP1R21, C12orf4, and Cryzl1, consistent with TBCK being part of the FERRY mRNA transport complex. Loss of TBCK leads to depletion of C12ORF4 protein levels across multiple cell types, suggesting TBCK may also play a role regulating at least some members of the FERRY complex. We find that TBCK preferentially, but not exclusively, localizes to the surface of endolysosomal vesicles and can colocalize with mRNA in lysosomes. Furthermore, TBCK-deficient neurons have reduced mRNA content in the axonal compartment relative to the soma. TBCK-deficient neurons show reduced levels of the lysosomal dynein/dynactin adapter protein JIP4, which functionally leads to TBCK-deficient neurons exhibiting striking lysosomal axonal retrograde trafficking defects. Hence, our work reveals that TBCK can mediate endolysosomal trafficking of mRNA, particularly along lysosomes in human axonal compartments. TBCK-deficiency leads to compartment-specific mRNA and lysosomal trafficking defects in neurons, which likely contribute to the preferential susceptibility to neurodegeneration.


Conflict of interest statement

Competing Interests Nothing to disclose

Figures

Fig. 1:
Fig. 1:. p.R126X mutation causes TBCK deficiency, morphological alterations and reduces neuronal survival.
a, Schematic representation of TBCK gene and protein. Mutation p.R126X (376C>T) is indicated relative to their position in the DNA. b,TBCK detection by immunofluorescence in iPSC-derived neurons (iNeurons) at 14 days of differentiation (14D) in control (Ctrl) and TBCK-deficient cells (p.R126X). c, Immunoblotting analysis of TBCK levels in control and p.R126X iNeurons (14D). d, Quantification of TBCK protein levels relative to GAPDH (n=4). Significance was calculated using unpaired t-test analysis. e, Immunofluorescence of TUJ1 showing morphologies of iNeurons at 3, 7 and 14D. f, Quantification of cell number by detention of nucleus signal employing CyQUANT (n=4). Significance was calculated using unpaired t-test analysis. g, Quantification of neuronal processes in control and p.R126X iN (n=3). Significance was calculated using unpaired t-test analysis. h, Determination of neurite outgrowth in control and p.R126X iN (n=3). Significance was calculated using unpaired t-test analysis. ***p<0.001 and ****p<0.001.All graphs show error bars with mean ± SD from independent experiments (n).
Fig. 2:
Fig. 2:. TBCK-deficient neurons show increased autophagy flux and alterations in mitochondrial respiration.
a, Immunoblot of mTOR, phospho-mTOR (p-mTOR) and its downstream target LC3B in iNeurons at 14D in control (Ctrl) and TBCK-deficient neurons (p.R126X). b-c, Quantification of p-mTOR and LCB-II in relative to their total levels (n=4). Significance was calculated using unpaired t-test analysis. d, Immunoblot of p62 in control (Ctrl) and TBCK-deficient neurons (p.R126X) at 14D. e, Quantification of p62 protein levels relative to GAPDH (n=4). Significance was calculated using unpaired t-test analysis. f, Seahorse assay showing mitochondrial Oxygen Consumption Rate (OCR) (n=6). g, OCR values corresponding to mean for each cell line baseline respiration (n=6). Significance was calculated using unpaired t-test analysis. h, Metabolic flux analysis showing mitochondrial ATP production rate (n=6). Significance was calculated using unpaired t-test analysis. *p<0.01, ***p<0.001 and ***p<0.001. All graphs show error bars with mean ± SD from independent experiments (n).
Fig. 3:
Fig. 3:. Proteomics in TBCK-deficient neurons reveals alterations in vesicular transport and associations with neurodegenerative diseases.
a, Volcano plot showing changes in abundance of proteins detected in iNeurons p.R126X compared with controls. Dashes lines indicate statistical significance cut off (horizontal, p<0.05 or −log10>1.301) and direction of fold change (vertical, left and right quadrants denote decreased and increased abundance, respectively (n=4). b, Gene Ontology (GO) classification of up-regulated proteins in TBCK-deficient neurons based on biological process (BP) (cut off p<0.05 and FC>1). c, Pathway analysis of up-regulated proteins, according to the Kyoto Encyclopedia of Genes and Genomes (KEGG) database (cut off p<0.05 and FC>1). d-g, Levels of proteins (PPP1R21 and CRYZL1) in iNeurons (controls and p.R126X) (n=4). h, Comparison between mRNAs bound to FERRY complex and our proteomics data. Significance was calculated using unpaired t-test analysis. i, Venn diagram showing upregulated proteins (41) or downregulated (30) from filtered mRNAs (71). j, GO classification based on cellular component (CC) of upregulated proteins from mRNAs (41) found in the FERRY complex. k, Classification by cellular component (CC) of downregulated proteins from mRNAs (30) found in the FERRY complex. Significantly enriched GO terms are shown with Benjamini-Hochberg FDR-corrected p-values. All graphs show error bars with mean ± SD from independent experiments (n).
Fig. 4:
Fig. 4:. TBCK interactome shows novel interactions associated with the FERRY complex.
a, Volcano plot showing mass spectrometry of proteins pulled down with TBCK performed in control iNeurons. The plot shows the log 2-difference in abundance of each protein with cut off p<0.05 (or −log10> 1.301). Interactors with high confidence are showed in colors different to black or gray (n=3). b, Representative immunoblot of PPP1R21 (blue asterisk) co-immunoprecipitated with TBCK in iNeurons. Input was loaded with 20μg of proteins. c, Immunoblot of TBCK (pink asterisk) co-immunoprecipitated with PPP1R21. Input was loaded with 20μg of proteins. d Left panel: Immunoblot of proteins co-immunoprecipitated with TBCK in iNeurons. Right panel: Immunoblot of proteins co-immunoprecipitated with PPP1R21. Input was loaded with 20μg of proteins. e, Immunoblot of iPSC-derived neurons expressing TBCK-HA or not (empty). f, Representative immunostaining of HA and PPP1R21 in iPSC-derived neurons expressing TBCK-HA. Orange square shows image magnification. g, Immunostaining of HA and JIP4 in iPSC-derived neurons expressing TBCK-HA. Orange square shows image magnification. h, Immunoblot of immunoprecipitated PPP1R21 from control and TBCK-deficient neurons (p.R126X). Pink asterisk identifies TBCK band and white PPP1R21.
Fig. 5:
Fig. 5:. TBCK post-transcriptionally regulates JIP4, C12orf4 and TRIM27 in cell-type-specific fashion.
a, Representative immunoblot showing less proteins levels of JIP4, C12orf4 and TRIM27 in controls (Ctrl) and TBCK-deficient neurons (p.R126X). b, Quantification of protein levels of JIP4, (c) C12orf4 and (d) TRIM27 in controls (Ctrl) and TBCK-deficient neurons (p.R126X) (n=4). Significance was calculated using unpaired t-test analysis. e, mRNA expression of SPAG9 (JIP4), (f) C12orf4 and (g) TRIM27 at different stages of differentiation (3, 7 and 14 days) in controls (Ctrl) and TBCK-deficient neurons (p.R126X) (n=3). Significance was calculated using two-way ANOVA with Sidak’s post hoc analysis for multiple comparison. h, Representative immunoblot of TBCK and C12orf4 in control and TBCK-deficient fibroblasts (p.R126X). i, Immunoblot of JIP4, PPP1R21, TRIM27, and CRYZL1 in control and TBCK-deficient fibroblasts (p.R126X). j, Schematic representation of C12orf4 gene showing the variant p.K213fs (c.637_638insAAAC) relative to its position in the DNA. k, Representative immunoblot showing deficiency of TBCK and C12orf4 in affected lymphoblastoid cell lines (LCLs) (p.K213fs) compared to controls. l, Quantification of protein levels of C12orf4 and (m) TBCK in control (Ctrl) and affected LCLs (p.K213fs) (n=4). Significance was calculated using unpaired t-test analysis. n, Immunoblots of C12orf4 and its interactors (JIP4, PPP1R21, TRIM27, and CRYZL1) in TBCK in control (Ctrl) and affected LCLs (p.K213fs). o, TBCK and C12ORF4 mutually regulate their protein levels, being TBCK the main regulator in this interaction. *p<0.01, **p<0.05, ***p<0.001 and ****p<0.001. All graphs show error bars with mean ± SD from independent experiments (n).
Fig. 6:
Fig. 6:. TBCK regulates the distribution and size of early endosomes through PPP1R21.
a, Representative confocal images showing RAB5 and (b) EEA1 in control (Ctrl) TBCK-deficient neurons (p.R126X). Inset magnifications (orange squares) show the distribution of early endosomes. c, Confocal images show PPP1R21 and RAB5 in control (Ctrl) TBCK-deficient neurons (p.R126X). Different inset magnifications (orange and blue squares) show the distribution and colocalization of PPP1R21 and RAB5. d, Confocal images showing PPP1R21 and EEA1 in control (Ctrl) TBCK-deficient neurons (p.R126X). Different inset magnifications (orange and blue squares) show the distribution and colocalization of PPP1R21 and EEA1. e, Representative immunoblot and (f) quantification of the early endosome marker, RAB5, in control (Ctrl) TBCK-deficient neurons (p.R126X). Significance was calculated using unpaired t-test analysis. g, Analysis of endosome size showing larger endosomes in TBCK-deficient neurons (p.R126X) compared to controls (Ctrl) (n=3). Significance was calculated using unpaired t-test analysis. h, Quantification of endosomes number shows fewer number of endosomes (EEA1+) in TBCK-deficient neurons (p.R126X) compared to controls (Ctrl) (n=3). Significance was calculated using unpaired t-test analysis. i, EEA1 and (j) PPP1R21 distribution along compartments of control (Ctrl) TBCK-deficient neurons (p.R126X). Cell compartments were identified and traced using Fiji, ImageJ (n=3). Significance was calculated using unpaired t-test analysis. k, Confocal images show PPP1R21 and EEA1 in control (Ctrl) TBCK-deficient fibroblasts (p.R126X). Different inset magnifications (orange squares) show the distribution and colocalization of PPP1R21 and EEA1. l, Staining of PPP1R21 and EEA1 in HEK293 cells transduced with ShRNA scramble (Sh Scr) and ShRNA TBCK#2 (Sh TBCK). Different inset magnifications (orange squares) show the distribution and colocalization of PPP1R21 and EEA1. *p<0.01, **p<0.05 and ***p<0.001. All graphs show error bars with mean ± SD from independent experiments (n).
Fig. 7:
Fig. 7:. TBCK deficiency causes defects in lysosome formation and trafficking.
a, Representative confocal images from a control iNeuron showing TBCK and LAMP1. Different inset magnifications (orange and blue squares) show the distribution and colocalization of TBCK and LAMP1 (3D= three-dimensional image). b, Confocal images of control neurons transduced with TBCK-HA and stained with anti-HA, PPP1R21 and LAMP1. Inset magnifications (blue, purple and orange) were taken from a long the neuron to show presence of FERRY complex (TBCK/PPP1R21) in lysosomes. Head arrows point colocalization of FERRY complex with lysosomes. c, Immunoblot of lysosomal marker (LAMP1) in control (Ctrl) and TBCK-deficient iNeurons (p.R126X). d, Quantification of LAMP1 (glycosylated and non-glycosylated) levels relative to GAPDH (n=4). Significance was calculated using unpaired t-test analysis. e, HyVolution confocal images in control and TBCK-deficient fibroblasts (p.R126X) showing PPP1R21 and RNA (Syto RNASelect). Different inset magnifications (orange squares) show the distribution and colocalization of PPP1R21 and RNA. f, Confocal images of control neurons labeled with Syto RNASelect to detect RNA and stained with anti-TBCK and LAMP1. Head arrows in the inset magnifications (blue squares) show colocalization of TBCK with LAMP1 and asterisks mark RNA within TBCK/lysosomes. g, Confocal images of control and TBCK-deficient neurons (p.R126X) plated on microfluid chamber showing lysosomes (LysoTracker) and RNA (Syto RNASelect) in soma and axons. h, Kymographs and analysis of (i) lysosome motility, (j) lysosome velocity and (k) RNA particles in control (Ctrl) and TBCK-deficient iNeurons (p.R126X) (n=3). Significance was calculated using unpaired t-test analysis. *p<0.01 and ***p<0.001. All graphs show error bars with mean ± SD from independent experiments (n).

References

    1. Chong J. X. et al. Recessive Inactivating Mutations in TBCK, Encoding a Rab GTPase-Activating Protein, Cause Severe Infantile Syndromic Encephalopathy. Am J Hum Genet 98, 772–781, doi:10.1016/j.ajhg.2016.01.016 (2016). - DOI - PMC - PubMed
    1. Bhoj E. J. et al. Mutations in TBCK, Encoding TBC1-Domain-Containing Kinase, Lead to a Recognizable Syndrome of Intellectual Disability and Hypotonia. Am J Hum Genet 98, 782–788, doi:10.1016/j.ajhg.2016.03.016 (2016). - DOI - PMC - PubMed
    1. Uhlen M. et al. Proteomics. Tissue-based map of the human proteome. Science 347, 1260419, doi:10.1126/science.1260419 (2015). - DOI - PubMed
    1. Liu Y., Yan X. & Zhou T. TBCK influences cell proliferation, cell size and mTOR signaling pathway. PLoS One 8, e71349, doi:10.1371/journal.pone.0071349 (2013). - DOI - PMC - PubMed
    1. Ortiz-Gonzalez X. R. et al. Homozygous boricua TBCK mutation causes neurodegeneration and aberrant autophagy. Ann Neurol 83, 153–165, doi:10.1002/ana.25130 (2018). - DOI - PMC - PubMed

Publication types

LinkOut - more resources