[Preprint]. 2025 Sep 29:2025.02.28.640798.
doi: 10.1101/2025.02.28.640798.

Independent signaling pathways provide a fail-safe mechanism to prevent tumorigenesis

Affiliations

Independent signaling pathways provide a fail-safe mechanism to prevent tumorigenesis

Sari Anschütz et al. bioRxiv. .

Abstract

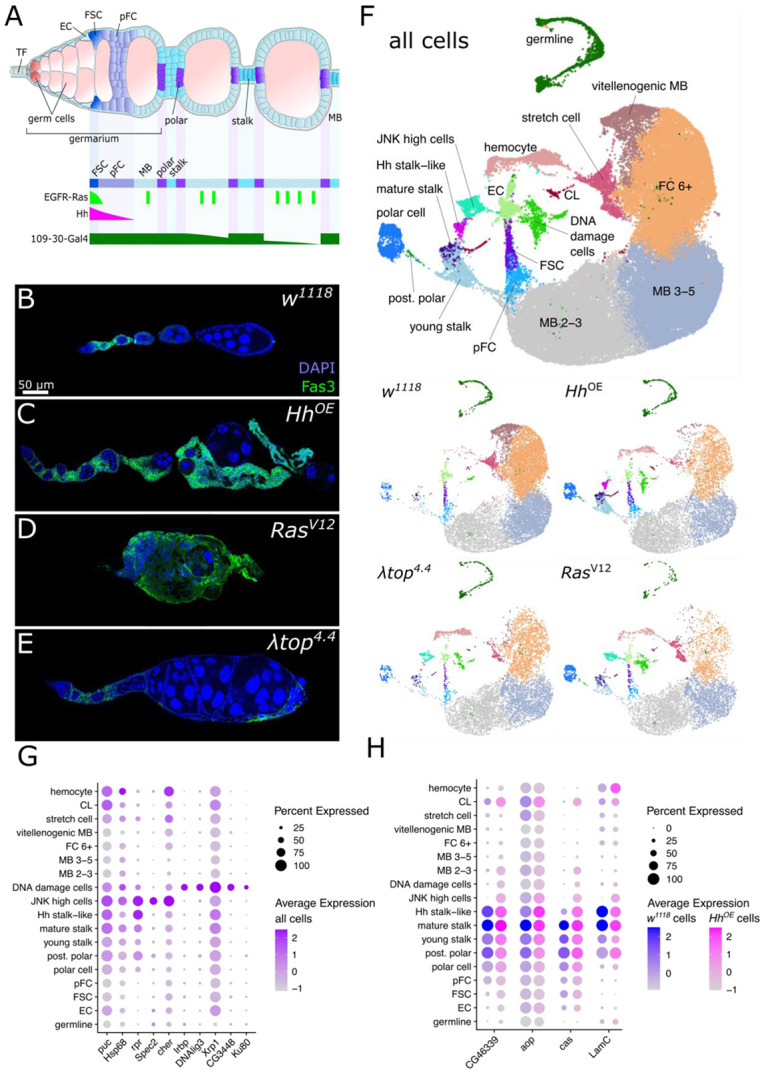
Controlled signaling activity is vital for normal tissue homeostasis and oncogenic signaling activation facilitates tumorigenesis. Here we use single-cell transcriptomics to investigate the effects of pro-proliferative signaling on epithelial homeostasis using the Drosophila follicle cell lineage. Notably, EGFR-Ras overactivation induces cell cycle defects by activating the transcription factors Pointed and E2f1 and impedes differentiation. Hh signaling simultaneously promotes an undifferentiated state and induces differentiation via activation of EMT-associated transcription factors zfh1 and Mef2. As a result, overactivation of Hh signaling generates a transcriptional hybrid state comparable to epithelial-mesenchymal-transition. Co-overactivation of Hh signaling with EGFR-Ras signaling blocks differentiation and induces key characteristics of tumor cells including a loss of tissue architecture caused by reduced expression of cell adhesion molecules, sustained proliferation and an evasion of cell cycle checkpoints. These findings provide new insight into how non-interacting signaling pathways converge at the transcriptional level to prevent malignant cell behavior.


Figures

Figure 1:
Figure 1:. Single-cell RNA-seq of follicle cells with overactivated signaling pathways
A) Graphic depiction of a Drosophila germarium and early stages of oogenesis and activity of EGFR-Ras, Hh signaling and the 109-30-Gal4 driver. TF: terminal filament, EC: escort cell, FSC: follicle stem cell, pFC: prefollicle cell, MB: main body follicle cell. B-E) Ovarioles of 109-30ts crossed to the respective alleles and stained for DAPI (blue) and Fas3 (green). F) Cluster identity represented on a UMAP plot of ovarian cells from all genotypes (all cells) or separate genotypes induced by 109-30ts as indicated. G) Percent and average expression of markers of the clusters “JNK high cells” and “DNA damage cells” in all cells. H) Percent and average expression of stalk cell markers in w1118 and HhOE cells.
Figure 2:
Figure 2:. Hh overactivation induces hybrid states in differentiated follicle cells
A) Bar chart displaying the log2 fold change of cluster contribution per cell type and genotype normalized to the respective wildtype population. B) Differential abundance testing of HhOE cells in comparison to control w1118 cells. C) A neighborhood graph of the w1118 and HhOE datasets. Note the multiple neighborhood overlaps between stalk cell neighborhoods and neighborhoods of polar cells and early MB cells. D) UMAP plot of w1118 and HhOE cells colored upon reference mapping to the Drosophila ovary atlas . Colors of cell types targeted by 109-30-Gal4 are displayed in the legend. For a full legend refer to Fig. S2H. E-F) Mapping score associated with (D) on a UMAP plot (E) and visualized via a DotPlot (F). G) UMAP plots of w1118 and HhOE datasets showing the expression of cas, eya and zfh1 as indicated. H-M) Ovarioles of 109-30-Gal4 crossed with w1118 as a control (H,J,L) or UAS-Hh (I,K,M) stained for (H-I) DAPI (blue), zfh1 (green) and Fas3 (magenta), (J-K) DAPI (blue), cas (green) and eya (magenta) and (L-M) DAPI (blue) and aop (green). N) UMAP plot of HhOE cells displaying sub-clusters of the MB 2-3 cluster. O) DotPlot showing average and percent expression in w1118 and HhOE clusters containing cells targeted by 109-30-Gal4.
Figure 3:
Figure 3:. RasV12 but not λtop4.4 induces the polar cell fate
A-B) Differential abundance testing of w1118 cells in comparison to (A) λtop4.4 or (B) RasV12 cells. C-D) Neighborhood graphs of w1118 cells and (C) λtop4.4 or (D) RasV12 cells. Note the multiple overlaps between polar cell and MB neighborhoods in (D). E-F) UMAP plots colored by cluster identity predicted by reference mapping to the Drosophila ovary atlas of (E) λtop4.4 or (F) RasV12 cells. A large number of cells identified as MB by unsupervised clustering are mapped as polar cells in the RasV12 dataset. G-I) Mapping score displayed on a UMAP plot for (G) λtop4.4 and (H) RasV12 cells and on a DotPlot (I). DotPlot scale is similar to Fig. 2F to allow for better comparison. J-L) Ovarioles driving Gal4 in polar cells under the upd promoter and combined with (J) w1118, (K) λtop4.4 or (L) RasV12 and stained for DAPI (blue) and Fas3 (green). Insets show a mature polar cell cluster (left) and a mature stalk (right). Note that polar cell specific expression of RasV12 but not λtop4.4 or the control results in more than 2 polar cells per cluster and double row stalks. M) Boxplot showing the quantification of polar cells per cluster (St. 5-7) of genotypes in (J-L). n = 25, 23, 18 ovarioles for w1118, λtop4.4 and RasV12 respectively. p from Kruskal-Wallis test for λtop4.4 = 0.9485 (ns), RasV12 = 1.791e-08 (***). N) DotPlot showing the expression of the polar cell marker dpn, the stalk cell marker LamC and cas and eya in the w1118, λtop4.4 and RasV12 clusters with 109-30-Gal4 activity. O) UMAP plots showing the expression of LamC and cas in the w1118, λtop4.4 and RasV12 datasets as indicated. Note that a subset of MB cells in the λtop4.4 and RasV12 expresses LamC and cas. P-S) Ovarioles expressing λtop4.4 (P,R) or RasV12 (Q,S) under the 109-30-Gal4 driver and stained for DAPI (blue) and cas (green) and eya (magenta) (P-Q) or eya and LamC (green (R-S). Insets show cells beyond the FSC/pFC domain which co-express cas and eya (P-Q) or eya and LamC (R-S). Arrow points out eya+ cells, filled arrowheads highlight LamC+ cells and empty arrowheads points at eya+ LamC+ cells.
Figure 4:
Figure 4:. EGFR-Ras signaling regulates main body follicle cell differentiation
A) UMAP plots of the indicated genotypes showing the regulon activity of the indicated transcription factor. High confidence regulons were identified by SCENIC analysis of the w1118 wildtype control datasets and expression analyzed using PercentageFeatureSet() of the Seurat package . B-C) Ovarioles of 109-30ts crossed with the wildtype w1118 (B) or inducing overexpression of zfh1 (C) stained for DAPI (blue) and Fas3 (green). Insets show a mature stalk region with individual stalk cells numbered. D) contains the associated quantification of cells per mature, single-row stalk. n = 13 and 16 stalks for w1118 and zfh1-OE respectively. p from student’s t test = 7.59e-05. E) Barplot presenting the penetrance of phenotypes induced by transcription factor overexpression. n: stalk formation: w1118 = 13, E2f1,Dp-OE = 18, long stalk: w1118 = 12, zfh1-OE = 16, fusions: w1118 = 13, E2f1-Dp-OE = 18, pnt.P1-OE = 18 ovarioles. p values from student's t-test: stalk formation: E2f1,Dp-OE = 2.00e-07, long stalk: zfh1-OE = 0.00281, fusions: E2f1-Dp-OE = 0.001755, pnt.P1-OE = 2.00e-07. F-G) Ovarioles of 109-30ts inducing overexpression of E2f1 and Dp (F) or pnt (G) and immunostained for DAPI (blue) and Fas3 (green). Insets show regions with morphological abnormalities in. H) UMAP plot of w1118, λtop4.4, RasV12 and HhOE cells scored for cell cycle phase. Note the switch from predominantly G2M to predominantly G1 phase in w1118 and HhOE MB cells, while no clear switch is visible in the λtop4.4 and RasV12 datasets. I) DotPlot of MB clusters of w1118, λtop4.4 and RasV12 datasets showing average and percent expression of genes inducing the mitosis to endocycle switch (stg, fzr) and stage specific MB markers. Markers of early MB Stages (CG15546, CG31808, SPARC) are not downregulated in lates stages of MB fates in the λtop4.4 and RasV12 datasets, while markers of differentiated MB cell fates are not induced (mirr, bond, CG8303, Yp2, psd, Vml, dpp).
Figure 5:
Figure 5:. Co-overactivation of Hh and EGFR-Ras pathways induces follicle cell tumors
A) Box chart showing the number of bin+Fas3+ cells in each of the indicated genotypes induced by 109-30ts. Double overactivations are separated into those interacting and non-interacting in FSCs. Simulated values were calculated by adding the difference of bin+Fas3+ cell number in each single overactivation compared to the wildtype. n = 5 germaria per genotype. n ≥ 13 germaria for each condition. p-values from student’s t-test defined as p ≥ 0.05: ns, p < 0.05: *, p < 0.01: **, p < 0.001: ***. B-C) Morphology of an entire ovariole stained for DAPI (blue), bin (green) and Fas3 (magenta) expressing (B) HhOE and λtop4.4 or (C) HhOE and RasV12 under the 109-30 driver. D) Survival assay of flies with 109-30ts driving the indicated genotypes. Flies with follicle cell-specific overexpression of HhOE and either λtop4.4 or RasV12 have a drastically reduced life span. n = 46, 28, 58, 33, 50, 40 flies from 5 different repeats for w1118; λtop4.4; RasV12; HhOE; HhOE,RasV12; HhOE,λtop4.4 respectively. p-values from Kaplan Meier analysis defined as p ≥ 0.05: ns, p < 0.05: *, p < 0.01: **, p < 0.001: ***. E-J) Immunostaining of ovarioles of 109-30ts driving HhOE,λtop4.4or HhOE,RasV12 as indicated. E-F) Ovarioles stained for DAPI (blue) and LamC (green). G-H) Ovarioles stained for DAPI (blue) and eya (green). I-J) Ovarioles stained for DAPI (blue), zfh1 (green) and Fas3 (magenta). K) UMAP plots of datasets of the indicated genotypes induced by 109-30ts. Samples of dataset 2 were reference mapped to dataset 1. Note that reference mapping required us to re-run the calculation of UMAP coordinates. Cluster identities of RasV12, λtop4.4 and HhOE datasets are equal to those reported above. L-M) Mapping score for the reference mapping of the HhOE,RasV12 and HhOE,λtop4.4 datasets on the UMAP (L) and visualized via a DotPlot (M). The scale of the DotPlot is similar to those reported above to allow comparison.
Figure 6:
Figure 6:. Hh-EGFR/Ras co-overactivation prevents differentiation and cell cycle checkpoints
A) Bar chart showing the log2 fold change of cluster contribution per cell type for the HhOE,RasV12 and HhOE,λtop4.4 datasets normalized to the respective wildtype population of the paired w1118 control datasets. NA marks absent cell populations. B) Differential abundance testing identifies a strong increase in FSCs and pFCs and a decrease of differentiated follicle cell types in the HhOE,RasV12 datasets in comparison to the paired w1118 datasets. C) Graph showing overlap between neighborhoods of the HhOE,RasV12 dataset with the paired w1118 dataset. D-I) Ovarioles with HhOE,λtop4.4 or HhOE,RasV12 induced in distinct subsets of follicle cells and stained for DAPI (blue) and Fas3 (green). D-E) Induction with stl-Gal4, which is active from pFCs onwards, F-G) with Wnt4-Gal4, which is inactive after the FSC state, H-I) CG46339-Gal4, a stalk cell driver. Induction with stl-Gal4 phenocopies the induction with the pan-follicle cell driver 109-30-Gal4. J) Wildtype germarium expressing Ptc-GFP (green) and stained for dpERK (magenta) and DAPI (blue). dpERK and Ptc-GFP are shown in colorimetric scale in (J’) and (J”), respectively. dpERK expression boundary is outlined with magenta and corresponds to the FSC/early pFC region. Ptc-GFP expression boundary is outlined with a green dotted line. A small population of cells posterior (right) to the dpERK expression boundary maintains Ptc-GFP expression and corresponds to the region harboring late pFCs. K) DotPlot showing average and percent expression in FSCs, pFCs and MB cells of Stages 2-3. Hh target genes which are expressed in wildtype pFCs are upregulated in the double overactivation datasets, while Hh targets which are stalk specific are not induced. L) UMAP plots of the paired wildtype control w1118 and the HhOE,λtop4.4 and HhOE,RasV12 datasets colored for the predicted cell cycle phase. M) Bar graph showing the percentage of cells per cluster in G1, G2M and S phase of the cell cycle. Note the increase of cells in G1 phase in the HhOE,λtop4.4 and HhOE,RasV12 datasets. N) DotPlot showing the expression of cell cycle checkpoint regulators, all of which are downregulated in the HhOE,λtop4.4 and HhOE,RasV12 datasets, particularly in FSCs and pFCs. Note that the low expression of some of the cell cycle regulators required the use of three scales.

References

    1. Chacón-Martínez C.A., Koester J., and Wickström S.A. (2018). Signaling in the stem cell niche: regulating cell fate, function and plasticity. Development 145, dev165399. - PubMed
    1. Feitelson M.A., Arzumanyan A., Kulathinal R.J., Blain S.W., Holcombe R.F., Mahajna J., Marino M., Martinez-Chantar M.L., Nawroth R., Sanchez-Garcia I., et al. (2015). Sustained proliferation in cancer: Mechanisms and novel therapeutic targets. Semin. Cancer Biol. 35 Suppl, S25–S54. - PMC - PubMed
    1. Bahar M.E., Kim H.J., and Kim D. (2023). Targeting the RAS/RAF/MAPK pathway for cancer therapy: from mechanism to clinical studies. Signal Transduct. Target. Ther. 8. 10.1038/s41392-023-01705-z. - DOI
    1. Uribe M.L., Marrocco I., and Yarden Y. (2021). EGFR in cancer: Signaling mechanisms, drugs, and acquired resistance. Cancers (Basel) 13, 2748. - PMC - PubMed
    1. Jiang J. (2022). Hedgehog signaling mechanism and role in cancer. Semin. Cancer Biol. 85, 107–122. - PMC - PubMed

Publication types