[Preprint]. 2025 Mar 18:2025.02.28.640914.
doi: 10.1101/2025.02.28.640914.

mTORC1 activation drives astrocyte reactivity in cortical tubers and brain organoid models of TSC

Affiliations

mTORC1 activation drives astrocyte reactivity in cortical tubers and brain organoid models of TSC

Thomas L Li et al. bioRxiv. .

Abstract

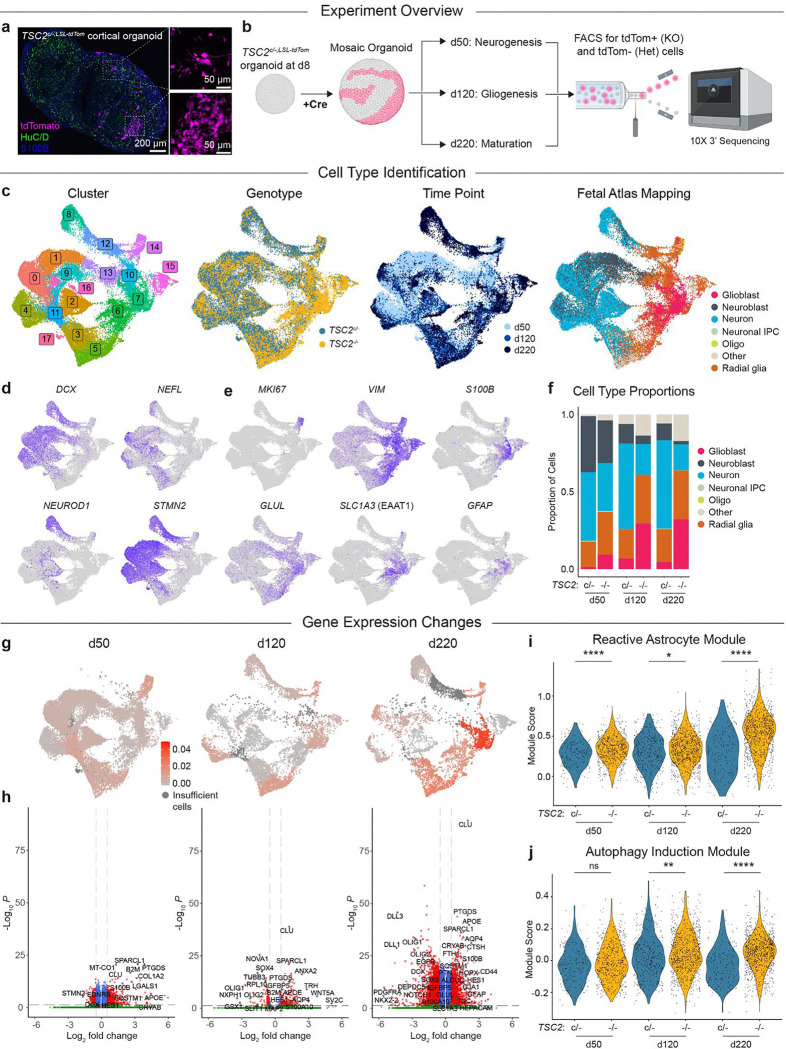
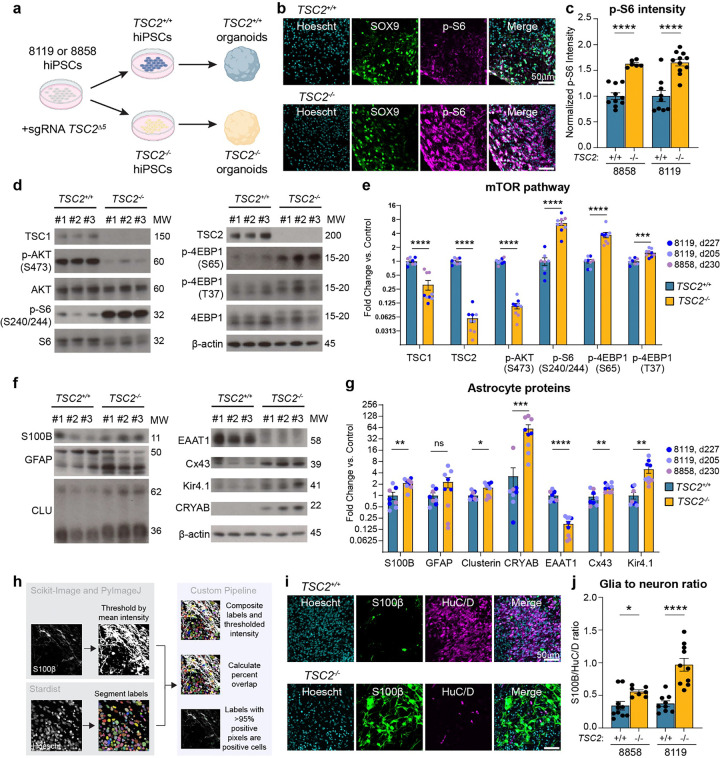
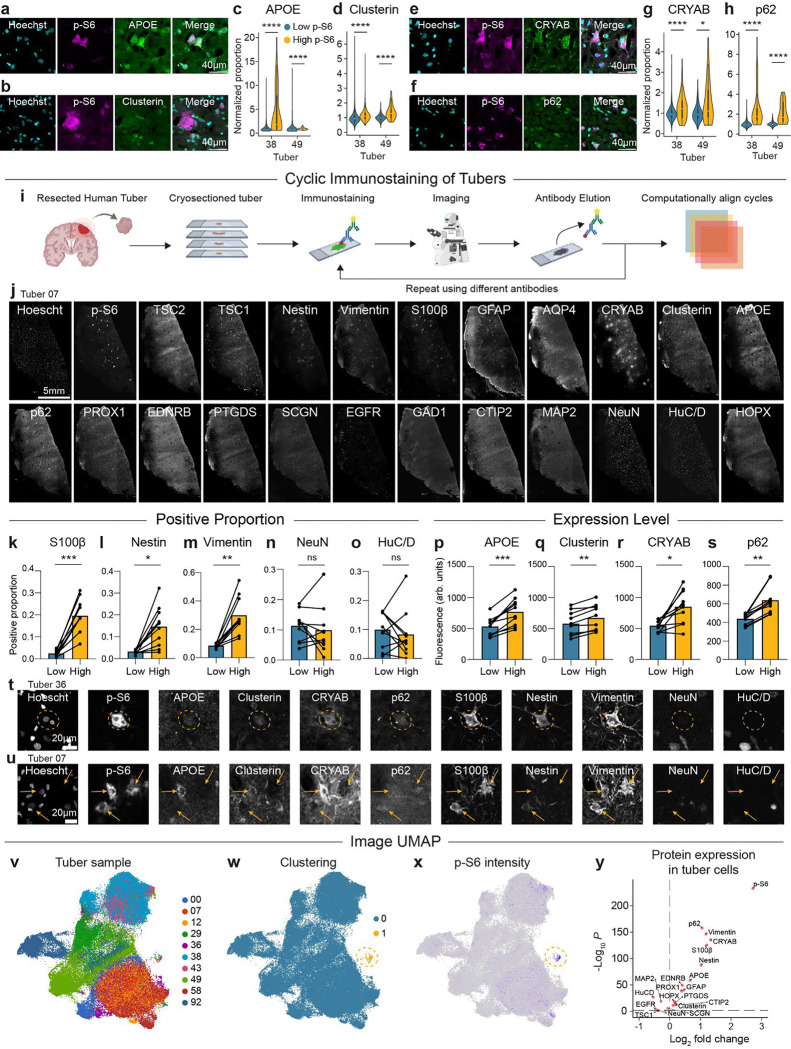
Tuberous Sclerosis Complex (TSC) is a genetic neurodevelopmental disorder associated with early onset epilepsy, intellectual disability and neuropsychiatric disorders. A hallmark of the disorder is cortical tubers, which are focal malformations of brain development containing dysplastic cells with hyperactive mTORC1 signaling. One barrier to developing therapeutic approaches and understanding the origins of tuber cells is the lack of a model system that recapitulates this pathology. To address this, we established a genetically mosaic cortical organoid system that models a somatic "second-hit" mutation, which is thought to drive the formation of tubers in TSC. With this model, we find that loss of TSC2 cell-autonomously promotes the differentiation of astrocytes, which exhibit features of a disease-associated reactive state. TSC2 -/- astrocytes have pronounced changes in morphology and upregulation of proteins that are risk factors for neurodegenerative diseases, such as clusterin and APOE. Using multiplexed immunofluorescence in primary tubers from TSC patients, we show that tuber cells with hyperactive mTORC1 activity also express reactive astrocyte proteins, and we identify a unique population of cells with expression profiles that match those observed in organoids. Together, this work reveals that reactive astrogliosis is a primary feature of TSC that arises early in cortical development. Dysfunctional glia are therefore poised to be drivers of pathophysiology, nominating a potential therapeutic target for treating TSC and related mTORopathies.


Conflict of interest statement

The authors declare no competing interests.

Figures

Extended Data Fig. 1:
Extended Data Fig. 1:. Validation of mosaic organoids, stem cell pluripotency, and gene editing
a, Schematic of the TSC2c/;LSL-TdTom genetic system, showing the insertion of the floxed exon 5 to generate a conditional TSC2 allele (left), together with a Cre-dependent TdTomato fluorescent reporter in the AAVS1 safe harbor locus (right). b, PCR genotyping for the TSC2 exon 5 deletion. The WT allele produces a 2000 bp product, the floxed exon 5 allele produces a 2070 bp product, and the exon 5 deleted allele produces a 1500 bp product. c, Example images of immunostained organoid sections showing TdTomato-positive cells in WIBR3 and BJ TSC2c/;LSL-TdTom organoids at day 79 (WIBR3) and day 85 (BJ). d, Images of human pluripotent stem cell colonies immunostained for the pluripotency markers OCT4 and NANOG in feeder-free cultures.
Extended Data Fig. 2:
Extended Data Fig. 2:. Pathway analysis of single-cell RNA sequencing data
a-d: Enriched pathways derived from Single Cell Pathway Analysis for the largest neuron cluster (a) and an astrocyte cluster (b) from WIBR3 TSC2c/;LSL-TdTom organoids, and the largest neuron cluster (c) and an astrocyte cluster (d) from BJ TSC2c/;LSL-TdTom organoids.
Extended Data Fig. 3:
Extended Data Fig. 3:. Single-cell RNA sequencing of WIBR3 TSC2c/+;LSL-TdTom brain organoids
a, Example image of an immunostained WIBR3 TSC2c/+;LSL-TdTom organoid showing tdTomato-positive TSC2+/ cells. HuC/D labels neurons in green and p-S6 is a read-out for mTORC1 activity in blue. b, Example images of day 120 TSC2c/+;LSL-TdTom organoid sections immunostained for S100β, TdTomato, and HuC/D (top images) or SOX9, TdTomato, and p-S6 (bottom images). c, Brain organoids were generated from TSC2c/+;LSL-TdTom hESCs and exposed to Cre lentivirus at day 8. Organoids were cultured until day 50 or 120, at which time they were dissociated, separated by FACS, and processed for 10x scRNA-seq. UMAP plots of scRNA-seq results, showing cells grouped by unbiased clustering, genotype, time point, and mapping to a fetal brain atlas. d, Feature plots of selected neuronal genes. e, Feature plots of selected astrocyte and progenitor genes. f, Cell type proportions, as assayed by atlas mapping, divided by genotype and time point. g, Cluster-based normalized expression distances between TSC2c/+ and TSC2+/ cells. Expression distances were calculated between the two genotypes within each cluster. h, Volcano plots of differential gene expression between TSC2c/+ and TSC2+/ cells in the astrocyte cluster (cluster 1) and a neuronal cluster (cluster 2) at day 50 and day 120. Genes more highly expressed in TSC2+/ cells have a positive Log2 fold change, and genes more highly expressed in TSC2c/+ cells have a negative Log2 fold change. h, Violin plots show module scores for a reactive astrocyte gene module divided by genotype. Violins show overall distributions and dots represent values for individual cells. See Supplemental Table 10 for statistics and sample sizes.
Extended Data Fig. 4:
Extended Data Fig. 4:. Additional single-cell RNA sequencing analyses
a, Spatial similarity mapping of each cluster for the WIBR3 TSC2c/;LSL-TdTom scRNA-seq dataset to the E18.5 mouse brain via VoxHunt. Bottom, spatial similarity maps for each cluster projected onto E18.5 sagittal mouse brains. b, Feature plots of genes related to neuronal subtype and regional identity in WIBR3 TSC2c/;LSL-TdTom organoids. c, Spatial similarity mapping of each cluster for the BJ TSC2c/;LSL-TdTom scRNA-seq dataset to the E18.5 mouse brain via VoxHunt. Bottom, spatial similarity maps for each cluster projected onto E18.5 sagittal mouse brains. d, Feature plots of genes related to neuronal subtype and regional identity in BJ TSC2c/;LSL-TdTom organoids. e,f, Violin plots show module scores calculated for immature (e) and mature (f) astrocyte gene modules in WIBR3 TSC2c/;LSL-TdTom organoids, divided by time point and genotype. Violins show overall distributions and dots represent values for individual cells. g,h, Module scores calculated for immature (g) and mature (h) astrocyte gene modules in BJ TSC2c/;LSL-TdTom organoids, divided by genotype. See Supplemental Table 10 for statistics and sample sizes.
Extended Data Fig. 5:
Extended Data Fig. 5:. Bulk RNA sequencing of TSC2+/+ and TSC2−/− organoids
a, Experimental schematic of organoid batches and genotypes collected for bulk RNA sequencing (differentiated from the 8119 hiPSC line). b, PCA plot of gene expression across all 18 samples, colored by genotype (left) or batch (right). c-m, Quantification (mean +/− SEM) of gene expression changes for selected candidate genes. Adjusted P values were calculated using the DESeq2 differential expression analysis. n, Quantification (mean +/− SEM) of the reactive astrocyte gene module score calculated for each sample. The P value was calculated using the Wilcoxon rank-sum test. For panels c-n, dots represent values for individual organoids.
Extended Data Fig. 6:
Extended Data Fig. 6:. Additional analysis of immunopanned astrocytes
a, Schematic of the soma size analysis pipeline, including segmentation of the nuclei and GFAP channels. b, Selected multinucleated cells from TSC2−/− and TSC2+/+ immunopanned astrocytes, immunostained for GFAP and the proliferation marker Ki67. c, Example images of GFAP and APOE immunostaining in astrocytes purified from day 350 TSC2+/+ and TSC2−/− organoids (8119 hiPSC line). f, Violin plots show quantification of APOE levels per cell. Violins show overall distributions, and the overlaid box-and-whisker plots show quartiles (dark lines) and the median (white lines). e, Example images of Ki67 and p-S6 immunostaining of astrocytes purified from day 240 TSC2+/+ and TSC2−/− organoids. f, Quantification of the proportion of Ki67-positive cells in TSC2+/+ and TSC2−/− astrocyte cultures isolated in parallel from day 240 organoids. Bars represent the mean and dots represent values for individual batches. A total of 66,308 cells were analyzed across 8 cultures (4 cultures per genotype). g, Example images of GFAP and S100β immunostaining in astrocytes purified from day 240 TSC2+/+ and TSC2−/− organoids (8119 hiPSC line). h,i Violin plots show quantification of GFAP (h) and S100β (i) levels per cell across batches and hiPSC lines. j-l Example immunostaining images of candidate DE proteins in astrocytes purified from day 240 TSC2+/+ and TSC2−/− organoids (8858 and 8119 hiPSC lines). m-r, Violin plots show quantification of Nestin (m), APOE (n), Vimentin (o), CRYAB (p), Clusterin (q), and p62 (r) levels per cell. For sample sizes, P values, and statistical tests of intensity-based measurements, see Supplemental Table 10.
Extended Data Fig. 7:
Extended Data Fig. 7:. Cyclic staining analysis pipeline and validation
a, Schematic of the analysis pipeline for aligning cells across cycles and generating the image UMAP. Tiles from the first cycle were stitched, then tiles from subsequent cycles were aligned to the first cycle using ASHLAR. Stardist was used to segment the nuclei channel of each cycle individually. For each segmented nucleus in the first cycle, the corresponding nucleus in subsequent cycles was found using nearest-neighbor analysis. After all nuclei were aligned, poor alignments were excluded using a threshold for the maximum distance between any two centroids across cycles for each nucleus. To generate the image UMAP, a 30-pixel radius around each centroid was selected for each cell and converted to a 1-D vector of values. These vectors were stacked to generate a 2-D matrix. This matrix was used to generate a UMAP projection for clustering and differential analysis. b, Example images of antibody elution across immunostaining cycles. After elution, samples were stained with Hoechst and re-imaged using the same exposure settings as the previous cycle to confirm that no residual signal remained.
Extended Data Fig. 8:
Extended Data Fig. 8:. Additional cyclic staining example images from TSC patient tubers
a, Example images of a high p-S6 astrocyte (yellow arrow) and a high p-S6 neuron (blue arrow) across all antibodies. b,c, Two sets of example images of high p-S6 cells expressing neuronal markers from different tubers. d,e, Two sets of example images of multinucleated high p-S6 cells expressing astrocytic markers from different tubers. f,g Example images of two selected tubers immunostained for p-S6 and TSC2 at two scales, showing that the brightest p-S6 cells tend to have depletion of TSC2 immunoreactivity.
Figure 1:
Figure 1:. Single-cell RNA sequencing of WIBR3 TSC2c/−;LSL-TdTom brain organoids
a, Example image of an immunostained WIBR3 TSC2c/;LSL-TdTom organoid showing tdTomato-positive TSC2−/− cells. HuC/D labels neurons in green and S100β labels glial cells in blue. b, Schematic of the experimental design. Brain organoids were generated from WIBR3 TSC2c/;LSL-TdTom hESCs and exposed to Cre lentivirus at day 8. Organoids were cultured until day 50, 120, or 220, at which time they were dissociated, separated by FACS, and processed for 10x scRNA-seq. c, UMAP plots of scRNA-seq results, grouping cells by unbiased clustering, genotype, time point, and mapping to a fetal brain atlas. d, Feature plots of selected neuronal genes. e, Feature plots of selected astrocyte and neural progenitor genes. f, Cell type proportions, as assayed by atlas mapping, divided by genotype and time point. g, Cluster-based normalized expression distances between TSC2−/− and TSC2c/ cells. Expression distances were calculated between the two genotypes within each cluster. h, Volcano plots of differential gene expression between TSC2−/− and TSC2c/ cells in cluster 7, an astrocyte cluster, at day 50, 120, and 220. Genes more highly expressed in TSC2−/− cells have a positive Log2 fold change, and genes more highly expressed in TSC2c/ cells have a negative Log2 fold change. i, Violin plots by genotype and time point displaying scores for a reactive astrocyte gene module within glioblast-mapped cells. Violins show overall distributions and dots represent values for individual cells. j, Module scores per cell for an autophagy induction gene module within glioblast-mapped cells. See Supplemental Table 10 for statistics and sample sizes.
Figure 2:
Figure 2:. Single-cell RNA sequencing of BJ TSC2c/−;LSL-TdTom brain organoids and combined astrocyte analysis
a, Example image of an immunostained BJ TSC2c/;LSL-TdTom organoid showing tdTomato-positive TSC2−/− cells. SOX2 (green) and FOXG1 (blue) label forebrain progenitor cells. b, UMAP plots of scRNA-seq results from BJ TSC2c/;LSL-TdTom brain organoids at day 140, grouping cells by unbiased clustering, genotype, and mapping to a fetal brain atlas. c, Feature plots of selected neuronal genes. d, Feature plots of selected astrocyte and progenitor genes. e, Cell type proportions, as assayed by mapping to a fetal brain atlas, divided by genotype. f, Cluster-based normalized expression distances between TSC2−/− and TSC2c/ cells. Expression distances were calculated between the two genotypes within each cluster. g, Volcano plots of differential gene expression between TSC2−/− and TSC2c/ cells in astrocyte clusters 1, 5, and 6. Genes more highly expressed in TSC2−/− cells have a positive Log2 fold change, and genes more highly expressed in TSC2c/ cells have a negative Log2 fold change. h, Violin plots displaying scores for a reactive astrocyte gene module. Violins show overall distributions and dots represent values for individual cells. i, Module scores per cell for an autophagy induction gene module. j, UMAP plots of glioblast-mapped cells from the WIBR3 and BJ organoids, divided by unbiased clustering, genotype, cell line, time point, and reactive astrocyte module score. k, Feature plots of selected astrocyte and oligodendrocyte precursor cell genes. l, Cluster proportions, divided by time point and genotype. The “early” time point consists of cells from day 50 organoids, the “middle” time point consists of cells from day 120 and 140 organoids, and the “late” time point consists of cells from day 220 organoids. m, Volcano plot of differential gene expression between TSC2−/− and TSC2c/ glioblasts across both hPSC lines at day 120–140. Genes more highly expressed in TSC2−/− cells have a positive Log2 fold change, and genes more highly expressed in TSC2c/ cells have a negative Log2 fold change. See Supplemental Table 10 for statistics and sample sizes.
Figure 3:
Figure 3:. Protein expression changes in TSC2−/− brain organoids
a, Schematic of the gene editing and brain organoid differentiation approach. b, Example images of SOX9 and p-S6 immunostaining in TSC2+/+ (top) and TSC2−/− (bottom) organoids at day 132 (8119 line). c, Quantification (mean ± SEM) of p-S6 intensity in cells from TSC2+/+ and TSC2−/− organoids. Dots represent values for individual organoids. d, Example western blots of mTOR pathway proteins, showing three independent samples per genotype. MW denotes the approximate molecular weight. e, Quantification (mean ± SEM) of western blot data. Dots represent values for individual organoids. For statistics, sample sizes, and batches see Supplemental Table 10. f, Example western blots of astrocyte-related proteins. g, Quantification (mean ± SEM) of western blot data. Dots represent values for individual organoids. h, Schematic of the binary thresholding method used to determine if a cell is positive for a given marker. i, Example images of S100β and HuC/D immunostaining in TSC2+/+ (top) and TSC2−/− (bottom) organoids at day 132 (8119 line). j, Quantification (mean ± SEM) of the glia to neuron ratio, as determined by the ratio of S100β and HuC/D positive cells in TSC2+/+ and TSC2−/− organoids. Dots represent individual organoids.
Figure 4:
Figure 4:. Purified astrocytes from TSC2−/− organoids have altered morphology and expression profiles
a, Schematic of the immunopanning process to isolate astrocytes from organoids. b, Example images of GFAP and SMI311 immunostaining in TSC2+/+ and TSC2−/− immunopanned astrocytes from day 240 organoids from the 8119 hiPSC line. c, Example western blots of candidate DE proteins in immunopanned astrocytes, showing three independent samples per genotype. MW denotes the approximate molecular weight. d, Quantification (mean ± SEM) of western blot data, each dot represents one organoid. e, Example images of GFAP immunostaining showing altered morphology of TSC2−/− astrocytes immunopanned from day 240 organoids from the 8119 hiPSC line. f, Example images of segmented somas (translucent) and corresponding seed nuclei (solid). g, Violin plots show quantification of soma size for TSC2+/+ and TSC2−/− astrocytes. Violins show overall distributions, and the overlaid box-and-whisker plots show quartiles (dark lines) and the median (white lines). h-k, Example images (i) and violin plots showing quantification of GFAP (h), S100β (j), and Nestin (k) levels in TSC2+/+ and TSC2−/− astrocytes. l-n, Example images (l) and violin plots showing quantifications of CRYAB (m), and Vimentin (n) in TSC2+/+ and TSC2−/− astrocytes. o-q, Example images (o) and quantifications of Clusterin (p), and p62 (q) in TSC2+/+ and TSC2−/− astrocytes. Experiments in panels f-q were performed on astrocytes purified from day 350 organoids from the 8119 hiPSC line. See Supplemental Table 10 for statistics and sample sizes.
Figure 5:
Figure 5:. High p-S6 cells in TSC patient tubers express reactive astrocyte proteins
a-h, Example images and quantifications of p-S6 levels and candidate DE proteins per cell: APOE (a,c), Clusterin (b,d), CRYAB (e,g), and p62 (f,h). Violin plots show overall distributions, and the overlaid box-and-whisker plots show quartiles (dark lines) and the median (white lines). i, Schematic of the 4i cyclic staining protocol. j, Example images of a single tuber section (tuber ID #07) stained using 23 different antibodies. k-o, Graphs showing the proportion of cells positive for different proteins between cells with high p-S6 (“high”) and all other cells (“low”) within the same tuber for S100β (k), Nestin (l), Vimentin (m), NeuN (n), and HuC/D (o). Bars represent the mean. p-s, Intensity comparisons between cells with high p-S6 and all other cells within the same tuber for APOE (p), Clusterin (q), CRYAB (r), and p62 (s). n=10 tubers per comparison. Reported p-values are adjusted using the Bonferroni correction. t,u Example images of tuber cells across selected channels from two different TSC patients. v,w, UMAP derived from individual cell images across all channels and tubers, plotted by tuber sample (v) and by unbiased clustering (w). x, Feature plot of p-S6 intensity. y, Volcano plot of differential intensity between cells in cluster 1 (high p-S6) and cluster 0 (all others). Proteins more highly expressed in cluster 1 cells have a positive Log2 fold change, and proteins more highly expressed in cluster 0 cells have a negative Log2 fold change. See Supplemental Table 10 for statistics and sample sizes.

References

    1. Lipton J. O. & Sahin M. The Neurology of mTOR. Neuron 84, 275–291 (2014). 10.1016/j.neuron.2014.09.034 - DOI - PMC - PubMed
    1. Northrup H. et al. Updated International Tuberous Sclerosis Complex Diagnostic Criteria and Surveillance and Management Recommendations. Pediatric Neurology 123, 50–66 (2021). 10.1016/j.pediatrneurol.2021.07.011 - DOI - PubMed
    1. Crino P. B., Nathanson K. L. & Henske E. P. The Tuberous Sclerosis Complex. N Engl J Med 355, 1345–1356 (2006). - PubMed
    1. Talos D. M. Cell-specific alterations of glutamate receptor expression in tuberous sclerosis complex cortical tubers. Ann Neurol 63, 454–465 (2008). - PMC - PubMed
    1. Mohamed A. R. Intrinsic epileptogenicity of cortical tubers revealed by intracranial EEG monitoring. Neurology 79, 2249–2257 (2012). - PubMed

Methods References

    1. Lengner C. J. et al. Derivation of Pre-X Inactivation Human Embryonic Stem Cells under Physiological Oxygen Concentrations. Cell 141, 872–883 (2010). - PubMed
    1. Li H. et al. Highly efficient generation of isogenic pluripotent stem cell models using prime editing. eLife 11, e79208 (2022). - PMC - PubMed
    1. Blair J. D., Bateup H. S. & Hockemeyer D. F. Establishment of Genome-edited Human Pluripotent Stem Cell Lines: From Targeting to Isolation. J. Vis. Exp. JoVE 53583 (2016) doi:10.3791/53583. - DOI - PMC - PubMed
    1. Blair J. D., Hockemeyer D. & Bateup H. S. Genetically engineered human cortical spheroid models of tuberous sclerosis. Nat Med 24, 1568–1578 (2018). - PMC - PubMed
    1. Cong L. et al. Multiplex Genome Engineering Using CRISPR/Cas Systems. Science 339, 819–823 (2013). - PMC - PubMed

Publication types

LinkOut - more resources