Empowering Global AMR Research Community: Interactive GIS dashboards for AMR data analysis and informed decision-making
- PMID: 40093312
- PMCID: PMC11910713
- DOI: 10.12688/wellcomeopenres.21010.4
Empowering Global AMR Research Community: Interactive GIS dashboards for AMR data analysis and informed decision-making
Abstract
Background: Antimicrobial Resistance (AMR) poses a global public health challenge, necessitating advanced tools to support data analysis, and visualization. This study introduces interactive Geographic Information System (GIS) dashboards as innovative platforms for AMR data analysis and visualization, offering comprehensive insights into resistance patterns, and geographic distribution across multiple countries, with a specific focus on Africa.
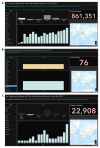
Methods: Three GIS dashboards were developed to address key objectives. The first integrates over 860,000 ATLAS data points from 83 countries, providing an interactive platform. Users can filter data by variables such as country, year, and region, enhancing data accessibility and visualization. The second dashboard focuses on the ATLAS dataset for Kenya and Uganda, incorporating detailed variables such as species, sample sources, and resistance phenotypes. The third involves Kampala, Uganda, to fill data gaps, enabling localized analyses through interactive features like geographic mapping and sample breakdowns by year.
Results: Sub-Saharan Africa faces three major challenges in handling antimicrobial resistance (AMR) data: limited accessibility for non-technical users, inefficiencies in processing large datasets, and insufficient longitudinal data for analysis. The introduction of interactive dashboards significantly improved AMR data visualization and interpretation across different scales. The global AMR dashboard effectively mapped geographical trends, uncovering critical data gaps, particularly the scarcity of AMR records from Africa. The Kenya and Uganda dashboard revealed key resistance patterns, highlighting the ineffectiveness of Ceftriaxone, Erythromycin, Levofloxacin, and Ampicillin against E. coli isolates. Additionally, the Kampala-specific dashboard, developed using simulated data, demonstrated the potential for localized AMR visualization, providing valuable insights where real-world data is limited. Across all platforms, the dashboards' interactive features enhanced data accessibility and streamlined trend identification, making AMR insights more interpretable, especially for researchers in Sub-Saharan Africa.
Conclusions: Interactive GIS dashboards enhance AMR data analysis in Sub-Saharan Africa by improving accessibility, efficiently handling large datasets, and addressing data gaps. Unlike spreadsheets such as Excel, which struggle with large datasets due to computer constraints, dashboards offer dynamic visualization, real-time updates, and intuitive data exploration.
Keywords: Antimicrobial Resistance (AMR); Data analysis; Geographic Information System (GIS) dashboards; Informed decision making.
Plain language summary
Antimicrobial Resistance (AMR) is increasingly serious global health issue, making it harder to treat common infections due to the reduced effectiveness of antibiotics. To address this challenge, researchers, healthcare providers, and professionals need tools to better understand AMR. This study introduces an interactive tool in the form of Geographic Information System (GIS) dashboards, which allow users to explore and analyze AMR datasets. The first objective was to create a global map that tracks antibiotic usage and resistance trends across multiple countries, enabling users to zoom in on specific areas, such as countries or years, for more detailed insights from ATLAS dataset. The second objective was to develop maps for Kenya and Uganda, highlighting the unique AMR challenges faced in these countries. The third goal focused on using this tool to address data gaps in Kampala, Uganda, and help users analyze AMR trends. These interactive maps are highly valuable. The global map reveals trends and identifies areas where data is lacking, especially in Africa. The maps for Kenya and Uganda show concerning resistance levels, where antibiotics are becoming ineffective against bacteria like E. coli. The Kampala map demonstrates how the tool can help provide a more detailed analysis of local AMR issues. Overall, these maps make it easier for experts to explore AMR data and identify key trends. In simple terms, these GIS dashboards are powerful tools for communicating and raising awareness about AMR. They allow us to visualize the spread of resistance and explore detailed AMR data. These interactive dashboards could play a crucial role in the global effort to combat AMR.
Copyright: © 2025 Opiyo SO et al.
Conflict of interest statement
No competing interests were disclosed.
Figures


Similar articles
-
Progress made in digitalizing antimicrobial resistance surveillance in a One Health approach in Kenya.Front Public Health. 2024 Sep 30;12:1411962. doi: 10.3389/fpubh.2024.1411962. eCollection 2024. Front Public Health. 2024. PMID: 39435404 Free PMC article.
-
Developing a Data Dashboard Framework for Population Health Surveillance: Widening Access to Clinical Trial Findings.JMIR Form Res. 2019 Apr 4;3(2):e11342. doi: 10.2196/11342. JMIR Form Res. 2019. PMID: 30946016 Free PMC article.
-
Digital Health Dashboards for Decision-Making to Enable Rapid Responses During Public Health Crises: Replicable and Scalable Methodology.JMIR Res Protoc. 2023 Jun 30;12:e46810. doi: 10.2196/46810. JMIR Res Protoc. 2023. PMID: 37389905 Free PMC article.
-
Progress on implementing the WHO-GLASS recommendations on priority pathogen-antibiotic sensitivity testing in Africa: A scoping review.Wellcome Open Res. 2024 Nov 22;9:692. doi: 10.12688/wellcomeopenres.23133.1. eCollection 2024. Wellcome Open Res. 2024. PMID: 39931110 Free PMC article.
-
Behavioral and Socio-Economic Determinants of Antimicrobial Resistance in Sub-Saharan Africa: A Systematic Review.Infect Drug Resist. 2025 Feb 13;18:855-873. doi: 10.2147/IDR.S503730. eCollection 2025. Infect Drug Resist. 2025. PMID: 39963371 Free PMC article. Review.
References
-
- WHO: Antimicrobial Resistance.2021. Reference Source
-
- Russell NJ, Stöhr W, Plakkal N, et al. : Patterns of antibiotic use, pathogens, and prediction of mortality in hospitalized neonates and young infants with sepsis: a global neonatal sepsis observational cohort study (NeoOBS). PLoS Med. 2023;20(6): e1004179. 10.1371/journal.pmed.1004179 - DOI - PMC - PubMed
-
- Kiggundu R, Lusaya E, Seni J, et al. : Identifying and addressing challenges to antimicrobial use surveillance in the human health sector in low- and middle-income countries: experiences and lessons learned from Tanzania and Uganda. Antimicrob Resist Infect Control. 2023;12(1): 9. 10.1186/s13756-023-01213-3 - DOI - PMC - PubMed
LinkOut - more resources
Full Text Sources

