. 2025 Feb 24;15(8):3532-3550.
doi: 10.7150/thno.103809. eCollection 2025.

The m6A modification of SOX18 leads to increased PTX3 and cardiomyocyte pyroptosis in sepsis-induced cardiomyopathy

Affiliations

The m6A modification of SOX18 leads to increased PTX3 and cardiomyocyte pyroptosis in sepsis-induced cardiomyopathy

He Sun et al. Theranostics. .

Abstract

Rationale: Sepsis-induced cardiomyopathy (SIC) is a rapidly progressing condition with poor prognosis in the absence of effective therapeutic interventions. Cardiomyocyte pyroptosis is a critical factor contributing to cardiac dysfunction in SIC. Currently, research on this mechanism remains unclear. Methods: We performed LPS-induced primary mouse cardiomyocyte modeling and mouse SIC modeling. Through mRNA-Seq, we found significant pyroptosis in the cardiac tissue of SIC mice. Further confocal microscopy and immunoprecipitation results confirmed that PTX3 is an important participant in cardiomyocyte pyroptosis. We then used ChIP and dual-luciferase reporter assays to confirm that SOX18 exerts a transcriptional repression effect on PTX3. M6A-Seq and RNA stability assays confirmed that the m6A modification mediated/recognized by RBM15/YTHDF2 is a crucial factor in the changes of SOX18 in SIC. Results: Our experiments demonstrated that the abnormally elevated PTX3 in SIC plays a key role in mediating pyroptosis. Under physiological conditions, PTX3 transcription is repressed by SOX18. However, during septic cardiomyopathy, SOX18 stability is compromised by RBM15/YTHDF2-mediated m6A modification, leading to increased PTX3 levels and the subsequent induction of cardiomyocyte pyroptosis. Conclusion: In summary, we have delineated the RBM15/YTHDF2-SOX18-PTX3 axis in SIC. It provides a new approach for the treatment of cardiomyocyte pyroptosis in SIC and for improving prognosis.

Keywords: N6-methyladenosine; PTX3; RBM15; SOX18; YTHDF2; pyroptosis; sepsis-induced cardiomyopathy.


Conflict of interest statement

Competing Interests: The authors have declared that no competing interest exists.

Figures
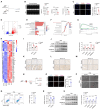
Figure 1
Figure 1
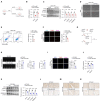
Elevated PTX3 in SIC contributes to the formation of the NLRP3 inflammasome. (A) Modeling strategy for Control and SIC mice groups. (B) Echocardiography results of mice (n = 6). (C) TUNEL staining results of cardiac tissue (n = 6). Scale bar: 25 μm. (D) Volcano plot displaying differentially expressed genes (n = 3). (E) GO enrichment analysis results. (F) KEGG pathway enrichment analysis results. (G) GSEA analysis results. (H) Heatmap showing pyroptosis-related genes. (I) qPCR detection of PTX3 and NLRP3 mRNA expression in cardiac tissue (n = 6). (J) Immunoblotting detection of PTX3, NLRP3, Cl-Casp1, and GSDMD protein expression in cardiac tissue (n = 6). (K, L, and M) Immunohistochemical detection of PTX3, IL-1β, and IL-18 expression in cardiac tissue. Scale bar: 20 μm. (N) Modeling strategy for primary cardiomyocytes from Control and LPS groups. (O) TUNEL staining results of primary cardiomyocytes (n = 6). Scale bar: 25 μm. (P) Scanning electron microscopy (SEM) results of primary cardiomyocytes. The red arrows indicate the membrane rupture observed during pyroptosis. (Q) Flow cytometry results for Active-Casp1 in primary cardiomyocytes (n = 3). (R) qPCR detection of PTX3 and NLRP3 mRNA expression in primary cardiomyocytes (n = 6). (S) Immunoblotting detection of PTX3, NLRP3, Cl-Casp1, and GSDMD protein expression in primary cardiomyocytes (n = 3).
Figure 2
Figure 2
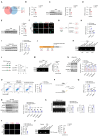
Inhibition of PTX3 effectively attenuates pyroptosis in cardiomyocytes during SIC. (A) Modeling strategy for LPS+si-NC and LPS+si-PTX3 groups of primary cardiomyocytes. (B) qPCR detection of PTX3 and NLRP3 mRNA expression in primary cardiomyocytes (n = 6). (C) Immunoblotting detection of PTX3, NLRP3, Cl-Casp1, and GSDMD protein expression in primary cardiomyocytes (n = 3). (D) SEM results of primary cardiomyocytes. The red arrows indicate the membrane rupture observed during pyroptosis. (E) Flow cytometry results for Active-Casp1 in primary cardiomyocytes (n = 3). (F) TUNEL staining results of primary cardiomyocytes (n = 6). Scale bar: 25 μm. (G) Modeling strategy for PTX3 cKO+SIC and WT+SIC groups of mice. (H) Echocardiography results of mice (n = 6). (I) TUNEL staining results of cardiac tissue (n = 6). Scale bar: 25 μm. (J) qPCR detection of PTX3 and NLRP3 mRNA expression in cardiac tissue (n = 6). (K) Immunoblotting detection of PTX3, NLRP3, Cl-Casp1, and GSDMD-N protein expression in cardiac tissue (n = 6). (L, M, and N) Immunohistochemical detection of PTX3, IL-1β, and IL-18 expression in cardiac tissue. Scale bar: 20 μm.
Figure 3
Figure 3
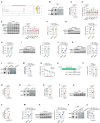
Downregulation of SOX18 leads to increased PTX3 in SIC. (A) Screening for transcription factors that may regulate PTX3. (B) qPCR analysis of SOX18 mRNA expression in mouse cardiac tissue (n = 6). (C) Western blot detection of SOX18 protein expression in mouse cardiac tissue (n = 3). (D) qPCR detection of SOX18 mRNA expression in primary mouse cardiomyocytes (n = 6). (E) Western blot detection of SOX18 protein expression in primary mouse cardiomyocytes (n = 3). (F) Immunofluorescence analysis of PTX3 and SOX18 expression in primary mouse cardiomyocytes. Scale bar: 25 μm. (G) Modeling strategy for LPS+Vector, LPS+oe-SOX18, and LPS+oe-SOX18+oe-PTX3 groups in primary cardiomyocytes. (H) qPCR analysis of SOX18 and PTX3 mRNA expression in primary mouse cardiomyocytes (n = 6). (I) Western blot detection of SOX18 and PTX3 protein expression in primary mouse cardiomyocytes (n = 3). (J) Schematic of PTX3 promoter and specific primer design. (K) ChIP-PCR results in primary mouse cardiomyocytes. (L) Plasmid construction schematic and dual-luciferase reporter assay (n = 3). (M) ChIP-qPCR results for site 3 in primary mouse cardiomyocytes (n = 3). (N) Western blot detection of PTX3, NLRP3, Cl-Casp1, and GSDMD-N protein expression in mouse cardiac tissue (n = 3). (O) Flow cytometry analysis of Active-Casp1 in primary mouse cardiomyocytes (n = 3). (P) Modeling strategy for SIC+AAV-null and SIC+AAV-SOX18 groups of mice. (Q) qPCR detection of SOX18, PTX3, and NLRP3 mRNA expression in mouse cardiac tissue (n = 6). (R) Western blot detection of SOX18, PTX3, NLRP3, Cl-Casp1, and GSDMD-N protein expression in mouse cardiac tissue (n = 6). (S) Echocardiography results of mice (n = 6). (T) TUNEL staining results of mouse cardiac tissue (n = 6). Scale bar: 25 μm. (U) ChIP-qPCR results for site 3 in mouse cardiac tissue (n = 3).
Figure 4
Figure 4
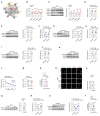
Downregulation of SOX18 is driven by RBM15-mediated m6A modification. (A) Prediction of m6A sites on SOX18 mRNA. (B) Dot blot analysis of global m6A modification levels in primary mouse cardiomyocytes. (C) MeRIP-qPCR detection of m6A modification levels on SOX18 mRNA in primary mouse cardiomyocytes (n = 3). (D) qPCR analysis of METTL3, METTL14, WTAP, and RBM15 mRNA expression in primary mouse cardiomyocytes (n = 6). (E) Western blot detection of METTL3, METTL14, WTAP, and RBM15 protein expression in primary mouse cardiomyocytes (n = 3). (F-K) Changes in SOX18 expression detected by qPCR and Western blot after knockdown of METTL3, METTL14, WTAP, and RBM15 in LPS-treated primary mouse cardiomyocytes. (L) Dot blot analysis of global m6A modification levels in primary mouse cardiomyocytes. (M) MeRIP analysis of SOX18 mRNA m6A modification levels in primary mouse cardiomyocytes (n = 3). (N) RNA stability experiment for SOX18. (O) Schematic of SOX18 mRNA m6A site mutations. (P) Dual-luciferase reporter assay. (Q) RIP-qPCR results of primary mouse cardiomyocytes (n = 3). (R) Dot blot analysis of global m6A modification levels in mouse cardiac tissue. (S) MeRIP-qPCR detection of SOX18 mRNA m6A modification levels in mouse cardiac tissue (n = 3). (T) qPCR analysis of RBM15 mRNA expression in primary mouse cardiomyocytes (n = 6). (U) Western blot detection of RBM15 protein expression in mouse cardiac tissue (n = 6). (V) RIP-qPCR results of mouse cardiac tissue (n = 3). (W) qPCR detection of RBM15 and SOX18 mRNA expression in mouse cardiac tissue (n = 6). (X) Western blot detection of RBM15 and SOX18 protein expression in mouse cardiac tissue (n = 6). (Y) Dot blot analysis of global m6A modification levels in mouse cardiac tissue. (Z) MeRIP-qPCR detection of SOX18 mRNA m6A modification levels in mouse cardiac tissue (n = 6).
Figure 5
Figure 5
YTHDF2 influences the stability of SOX18 mRNA. (A) m6A readers associated with RBM15. (B) qPCR detection of YTHDF1, YTHDF2, YTHDC1, and IGF2BP2 mRNA expression in primary mouse cardiomyocytes (n = 6). (C) Western blot detection of YTHDF1, YTHDF2, YTHDC1, and IGF2BP2 protein expression in primary mouse cardiomyocytes (n = 3). (D-K) Changes in SOX18 expression detected by qPCR and Western blot after knockdown of YTHDF1, YTHDF2, YTHDC1, and IGF2BP2 in LPS-treated primary mouse cardiomyocytes. (L) RNA stability assay for SOX18. (M) Dual-luciferase reporter assay. (N) RIP-qPCR results of primary mouse cardiomyocytes (n = 3). (O) Immunofluorescence analysis of YTHDF2 and SOX18 expression in primary mouse cardiomyocytes. Scale bar: 25 μm. (P) qPCR detection of YTHDF2 mRNA expression in mouse cardiac tissue (n = 6). (Q) Western blot detection of YTHDF2 mRNA expression in mouse cardiac tissue (n = 6). (R) qPCR detection of YTHDF2 and SOX18 mRNA expression in mouse cardiac tissue (n = 6). (S) Western blot detection of YTHDF2 and SOX18 protein expression in mouse cardiac tissue (n = 6). (T) RIP-qPCR results of mouse cardiac tissue (n = 3).
Figure 6
Figure 6
Inhibition of RBM15/YTHDF2 effectively attenuates pyroptosis in cardiomyocytes during SIC. (A) qPCR detection of PTX3 and NLRP3 mRNA expression in primary mouse cardiomyocytes (n = 6). (B) Western blot detection of PTX3 and NLRP3 protein expression in primary mouse cardiomyocytes (n = 3). (C) SEM results of primary mouse cardiomyocytes. The red arrows indicate the membrane rupture observed during pyroptosis. (D) Flow cytometry analysis of Active-Casp1 in primary mouse cardiomyocytes (n = 3). (E) TUNEL staining results of primary mouse cardiomyocytes (n = 6). (F) qPCR detection of PTX3 and NLRP3 mRNA expression in mouse cardiac tissue (n = 6). (G) Western blot detection of PTX3 and NLRP3 protein expression in mouse cardiac tissue (n = 3). (H, I) Immunohistochemistry analysis of IL-1β and IL-18 expression in mouse cardiac tissue. Scale bar: 20 μm. (J) Echocardiography results in mice (n = 6). (K) TUNEL staining results of mouse cardiac tissue (n = 6). Scale bar: 25 μm.
Figure 7
Figure 7
Validation of the RBM15/YTHDF2-SOX18-PTX3 axis in the CLP model. (A) Experimental design of Sham and CLP groups in mice. (B) GSEA analysis of pyroptosis-related pathway changes in the heart of CLP group mice. (C) Heatmap showing the differential expression of pyroptosis-related genes in the heart of Sham and CLP group mice. (D) Heatmap showing the differential expression of PTX3, RBM15, YTHDF2, and SOX18 in the heart of Sham and CLP group mice. (E) ChIP-PCR/qPCR results of Sham and CLP group mice heart (n = 6). (F) Dot blot results. (G) m6A modification status of all mRNAs in the heart of Sham and CLP group mice. (H) m6A modification status of SOX18 mRNA in the heart of Sham and CLP group mice. (I) MeRIP-qPCR results of SOX18 mRNA in the heart of Sham and CLP group mice (n = 6). (J) RIP-qPCR results of SOX18 mRNA in the heart of Sham and CLP group mice (n = 6). (K) Immunoblot results for heart tissues from different groups of mice (n = 6). (L) Echocardiographic results from mice in different groups (n = 6). (M) ChIP-PCR/qPCR results of heart from CLP and CLP+AAV-SOX18 groups (n = 6). (N) MeRIP-qPCR results of SOX18 mRNA in the heart of CLP and CLP+AAV-shRBM15 groups (n = 6).

References

    1. Cajander S, Kox M, Scicluna BP, Weigand MA, Mora RA, Flohé SB. et al. Profiling the dysregulated immune response in sepsis: overcoming challenges to achieve the goal of precision medicine. The Lancet Respiratory medicine. 2024;12:305–22. - PubMed
    1. Hollenberg SM, Singer M. Pathophysiology of sepsis-induced cardiomyopathy. Nature reviews Cardiology. 2021;18:424–34. - PubMed
    1. Lv X, Wang H. Pathophysiology of sepsis-induced myocardial dysfunction. Military Medical Research. 2016;3:30. - PMC - PubMed
    1. Li N, Zhou H, Wu H, Wu Q, Duan M, Deng W. et al. STING-IRF3 contributes to lipopolysaccharide-induced cardiac dysfunction, inflammation, apoptosis and pyroptosis by activating NLRP3. Redox biology. 2019;24:101215. - PMC - PubMed
    1. Newton K, Strasser A, Kayagaki N, Dixit VM. Cell death. Cell. 2024;187:235–56. - PubMed

MeSH terms