. 2025 Jul 11;23(3):qzaf025.
doi: 10.1093/gpbjnl/qzaf025.

LCORL and STC2 Variants Increase Body Size and Growth Rate in Cattle and Other Animals

Affiliations

LCORL and STC2 Variants Increase Body Size and Growth Rate in Cattle and Other Animals

Fengting Bai 白凤庭 et al. Genomics Proteomics Bioinformatics. .

Abstract

Natural variants can significantly improve growth traits in livestock and serve as safe targets for gene editing, thus being applied in animal molecular design breeding. However, such safe and large-effect mutations are severely lacking. Using ancestral recombination graphs, we investigated recent selection signatures in beef cattle breeds, pinpointing sweep-driving variants in the LCORL and STC2 loci with notable effects on body size and growth rate. The ACT-to-A frameshift mutation in LCORL occurs mainly in central-European cattle, and stimulates growth. Remarkably, convergent truncating mutations were also found in commercial breeds of sheep, goats, pigs, horses, dogs, rabbits, and chickens. In the STC2 gene, we identified a missense mutation (A60P) located within the conserved region across vertebrates. We validated the two natural mutations in gene-edited mouse models, where both variants in homozygous carriers significantly increase the average weight by 11%. Our findings provide insights into a seemingly recurring gene target of body size enhancing truncating mutations across domesticated species, and offer valuable targets for gene editing-based breeding in animals.

Keywords: LCORL; STC2; Ancestral recombination graph; Common improving gene; Convergent selection.


Conflict of interest statement

Yu Jiang, Yudong Cai, Fengting Bai, Min Qiu, Chen Liang, and Yanshuai Feng are inventors on two patent applications related to this work submitted on 27 December 2024 by Northwest A&F University (Patent Application Nos. 202411951967.8 and 202411951964.4). The other authors declare that they have no competing interests.

Figures

Graphical abstract
Graphical abstract
Figure 1
Figure 1
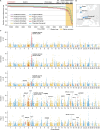
Divergence time of five European beef cattle breeds and selection analysis over the past 1000 years A. Relative cross-coalescence rates among the five beef cattle breeds inferred from the ARG. Around 1000 years ago, genetic divergence among the breeds accelerated, coinciding with a gradual recovery in the body size of domestic cattle. B. Geographic origins of the five European beef cattle breeds studied in this research. C. CLUES analyses of highly differentiated biallelic SNVs across the five cattle breeds. Genes overlapping or nearest of the CLUES-selected SNVs are annotated. Selected genes associated with human body size are in bold. The black dashed line represents the ln LR threshold for rejecting neutral mutations. Variants located within cattle body size QTLs are highlighted in red. ARG, ancestral recombination graph; YBP, years before present; SNV; single nucleotide variant; LR, likelihood ratio; QTL, quantitative trait locus.
Figure 2
Figure 2
The rs384548488 mutation at LCORL is a candidate variant for cattle growth in the NCAPG-LCORL region A. Detailed plots for Chr6:37,180,233–37,817,575 encompassing the NCAPG-LCORL locus. The left column presents zoomed-in Manhattan plots of ln LR for each breed. The right column shows allele frequency trajectories for the five shared selective SNVs in the CLUES analysis. Gray shading highlights the time range from 1000 years ago to the present. B. A clear difference is observed between D and A haplotypes, and the notably lower diversity of D haplotypes suggests a selective sweep. The alternative allele relative to the reference genome is indicated in red. D haplotypes (n = 315), A haplotypes (n = 425). C. The absolute frequency difference between D and A haplotypes. SNVs are represented by circles, while INDELs are represented by squares. D. Schematic of the LCORL gene structure and its transcripts. The frameshift mutation (rs384548488) is highlighted by a red vertical line. Below the gene structure is a schematic of the truncation in the PALI2 protein, an isoform expression product of LCORL, caused by rs384548488. E. The rs384548488 variant is associated with cattle average daily gain variation. The left plot shows the NCAPG-LCORL locus as a QTL for average daily gain [12]. The red line is the nominal significance at P = 1 × 10⁻⁵. The right plot demonstrates a significant positive correlation between the −log10  P value of variants in average daily gain GWAS and their LD (R2) with rs384548488, indicating that rs384548488 is linked to growth traits. DAF, derived allele frequency; INDEL, insertion and deletion; GWAS, genome-wide association study; LD, linkage disequilibrium; PIP, PALI interaction with PRC2; PALI2, PRC2-associated LCORL isoform 2.
Figure 3
Figure 3
The pLoPD mutation increases body weight and body length in mice A. Total body weight of wild-type (+/+), heterozygous (+/−), and homozygous (−/−) PALI2 PIP domain knockout mice from 3 to 9 weeks of age. Number of male mice in each genotype: wild-type (n = 10), heterozygous (n = 10), and homozygous (n = 10). Number of female mice in each genotype: wild-type (n = 10), heterozygous (n = 9), and homozygous (n = 9). Error bars represent mean ± SE. Significant difference in body weight between Pali2−/− and Pali2+/+ mice at each time point was determined by two-sided Student’s t-test (notations above each time point). Significant difference in body weight between the three genotypes of male mice (49 to 63 days) or female mice (25 to 63 days) was determined by two-way ANOVA followed by Tukey’s post hoc test (notations on the far right). B. Body length of Pali2+/+, Pali2+/−, and Pali2−/− mice at 7 weeks of age. Number of male mice in each genotype: wild-type (n = 14), heterozygous (n = 23), and homozygous (n = 19). Number of female mice in each genotype: wild-type (n = 8), heterozygous (n = 32), and homozygous (n = 9). Error bars represent mean ± SE. Significant difference was determined by one-way ANOVA followed by Tukey’s post hoc test. C. Western blot analysis of H3K27me3 using the whole-cell lysates from wild-type and mutant mouse embryos at E14 and from muscle and thymus tissues of wild-type and mutant adult mice, probed with the indicated antibodies. *, P < 0.05; **, P < 0.005; ***, P < 0.0005; ns, not significant. pLoPD, predicted loss-of-PIP-domain; ANOVA, analysis of variance; SE, standard error.
Figure 4
Figure 4
The loss of the PIP domain in PALI2 across eight domesticated animals A. Schematic representations of the LCORL and PALI2 proteins, two products encoded by the LCORL gene. The phylogenetic tree is based on the UCSC 100 Vertebrates dataset. Natural pLoPD mutations are observed in cattle, goats, sheep, pigs, horses, dogs, rabbits, and chickens, without affecting the LCORL protein. The HTH Psq domain, unique to the LCORL protein, is highlighted in green, while the PIP domain, specific to the PALI2 protein, is shown in blue. The regions altered by pLoPD mutations are marked in red, and the shared regions between the two forms are colored in gray. B. Distribution of pLoPD mutations in wild species and domesticated breeds or populations. The wild ancestors include the extinct wild ancestors for cattle and horses, the bezoar for goats, the Asian mouflon for sheep, the Eurasian wild boar for pigs, the gray wolf for dogs, the European wild rabbit for rabbits, and Gallus gallus spadiceus for wild chicken. The domesticated breeds or populations depicted are: Cattle — the Angus cattle, a European small beef breed, and the Charolais cattle, a European large beef breed; Goat — two types of Pakistani goat populations reported by Saif et al. [30]: the Pakistani goat breeds with and without the selection signature at the LCORL locus; Sheep — the Hu sheep, an Asian local breed, and the Merino sheep, a European commercial breed; Pig — the Meishan pig, an Asian local breed, and the Duroc pig, a European commercial meat breed; Dog — small breeds (weight < 10 kg) and large breeds (weight > 41 kg) based on the report by Plassais and colleagues [3]; Rabbit — the Dutch and Flemish Giant rabbits; Chicken — the commercial egg-laying White Leghorn and the commercial meat-producing White Plymouth Rock chickens. pLoPD refers to alleles predicted to result in the loss of the PIP domain in PAIL2, while non-pLoPD refers to alleles without such predicted effects. Detailed population and breed information is provided in Tables S12 and S13. AA, amino acid.
Figure 5
Figure 5
Selective sweep and functional analysis of STC2 variants A. Detailed plots for Chr20:4,598,655–5,366,902, containing the STC2 locus. The upper row shows zoomed-in Manhattan plots of ln LR for each breed. The lower row shows allele frequency trajectories for the top SNVs in the CLUES analysis and the missense SNVs. Gray shading indicates the time range from 1000 years ago to the present. B. Stacked bar plot of the haplotypes comprising rs110540352 and rs42661323 in the Hereford cattle (n = 200 haplotypes). The two derived alleles (rs110540352*G and rs42661323*G) are almost always inherited together as a single haplotype. The y-axis represents the number of haplotypes, and the x-axis represents the indicated SNVs. C. rs42661323 is the lead GWAS SNV for yearling weight and average daily gain in cattle. The GWAS data source is the same as in Figure 2C and Figure S5. D. Conservation analysis of the amino acid residue at position 60 of STC2. The amino acid residues at positions 60–66 of STC2 interact with PAPP-A, marked with blue shading.
Figure 6
Figure 6
STC2 A60P increases body weight and body length in mice A. Total body weight of indicated littermates from 3 to 9 weeks of age. Number of male mice in each genotype: Stc2+/+ (n = 12), Stc2A60P/+ (n = 40), and Stc2A60P/A60P (n = 17). Number of female mice in each genotype: Stc2+/+ (n = 12), Stc2A60P/+ (n = 30), and Stc2A60P/A60P (n = 13). Error bars represent mean ± SE. Significant difference in body weight between Stc2A60P/A60P and Stc2+/+ mice at each time point was determined by two-sided Student’s t-test (notations above each time point). Significant difference in body weight between the three genotypes of male mice (22 to 63 days) or female mice (22 to 63 days) was determined by two-way ANOVA followed by Tukey’s post hoc test (notations on the far right). B. Body length of Stc2+/+, Stc2A60P/+, Stc2A60P/A60P mice at 14 weeks of age. Number of male mice in each genotype: Stc2+/+ (n = 12), Stc2A60P/+ (n = 40), and Stc2A60P/A60P (n = 17). Number of female mice in each genotype: Stc2+/+ (n = 12), Stc2A60P/+ (n = 30), and Stc2A60P/A60P (n = 13). Error bars represent mean ± SE. Significant difference was determined by one-way ANOVA followed by Tukey’s post hoc test. C. Representative images of littermates of Stc2+/+, Stc2A60P/+, and Stc2A60P/A60P mice. *, P < 0.05; **, P < 0.005; ***, P < 0.0005; ns, not significant.
Figure 7
Figure 7
Distribution and evolution of LCORL and STC2 variants in cattle A. Geographical distribution of erived alleles at the LCORL (rs384548488*A) and STC2 (rs110540352*G and rs42661323*G) loci. Blue and orange indicate the derived and ancestral alleles, respectively. Half-orange and half-blue triangles and circles indicate the heterozygous ancient and modern cattle, respectively. The modern cattle data are from Run 9 of the 1000 Bull Genomes Project. B. Genotypes of LCORL and STC2 loci in ancient cattle. Triangles indicate the casual variants. Missing genotypes are colored in gray, homozygotes for ancestral allele are colored in light yellow, heterozygotes are colored in orange, and homozygotes for derived allele are colored in dark red.

References

    1. Ajmone-Marsan P, Garcia JF, Lenstra JA. On the origin of cattle: how aurochs became cattle and colonized the world. Evol Anthropol 2010;19:148–57.
    1. Bouwman AC, Daetwyler HD, Chamberlain AJ, Ponce CH, Sargolzaei M, Schenkel FS, et al. Meta-analysis of genome-wide association studies for cattle stature identifies common genes that regulate body size in mammals. Nat Genet 2018;50:362–7. - PubMed
    1. Plassais J, Kim J, Davis BW, Karyadi DM, Hogan AN, Harris AC, et al. Whole genome sequencing of canids reveals genomic regions under selection and variants influencing morphology. Nat Commun 2019;10:1489. - PMC - PubMed
    1. Hongo H, Pearson J, Öksüz B, Ilgezdi G. The process of ungulate domestication at Çayönü, Southeastern Turkey: a multidisciplinary approach focusing on Bos sp. and Cervus elaphus. Anthropozoologica 2009;44:63–78.
    1. Vigne JD, Peters J, Helmer D. First Steps of Animal Domestication. Oxford: Oxbow Books; 2005.

Substances

LinkOut - more resources