. 2025 Mar 17;82(1):118.
doi: 10.1007/s00018-025-05643-7.

Interneuron migration impairment and brain region-specific DNA damage response following irradiation during early neurogenesis in mice

Affiliations

Interneuron migration impairment and brain region-specific DNA damage response following irradiation during early neurogenesis in mice

Lisa Berden et al. Cell Mol Life Sci. .

Erratum in

Abstract

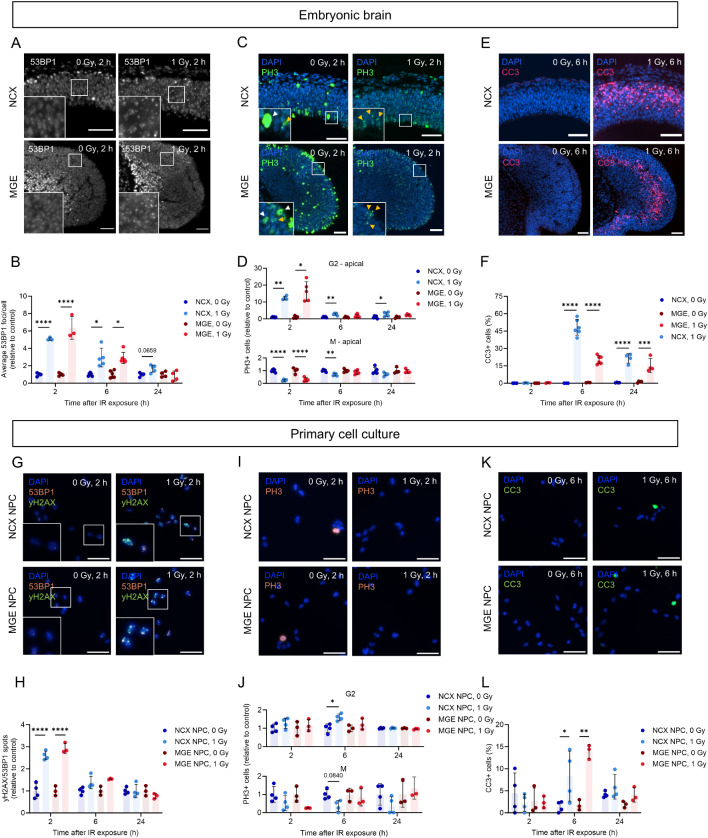
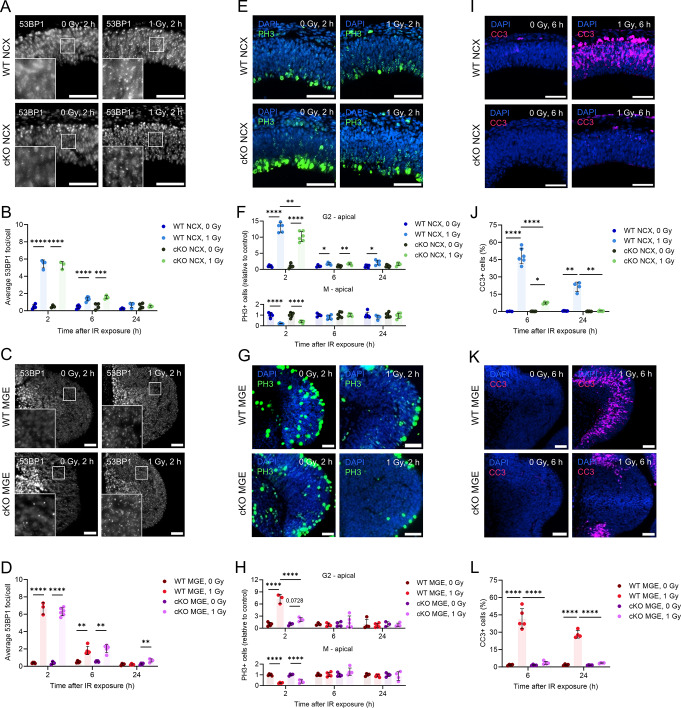
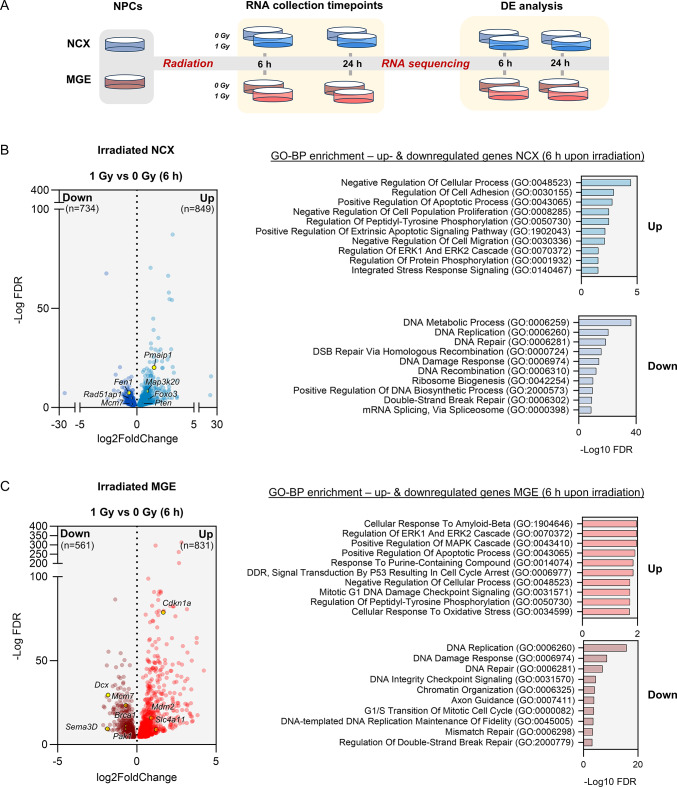
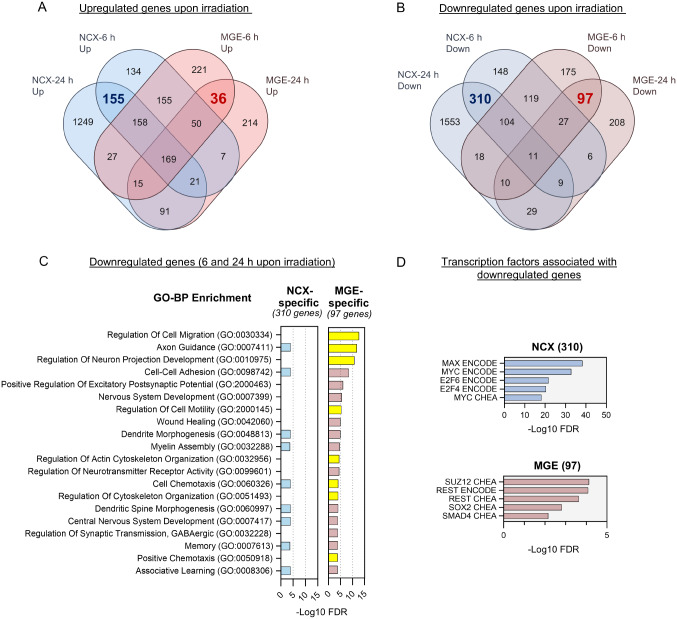
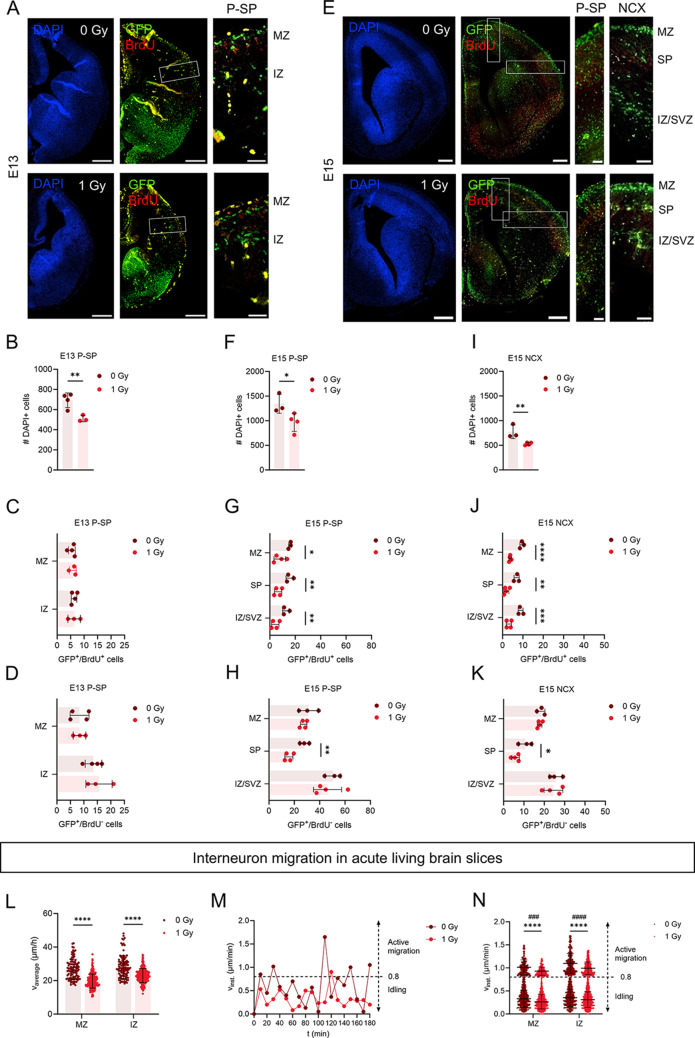
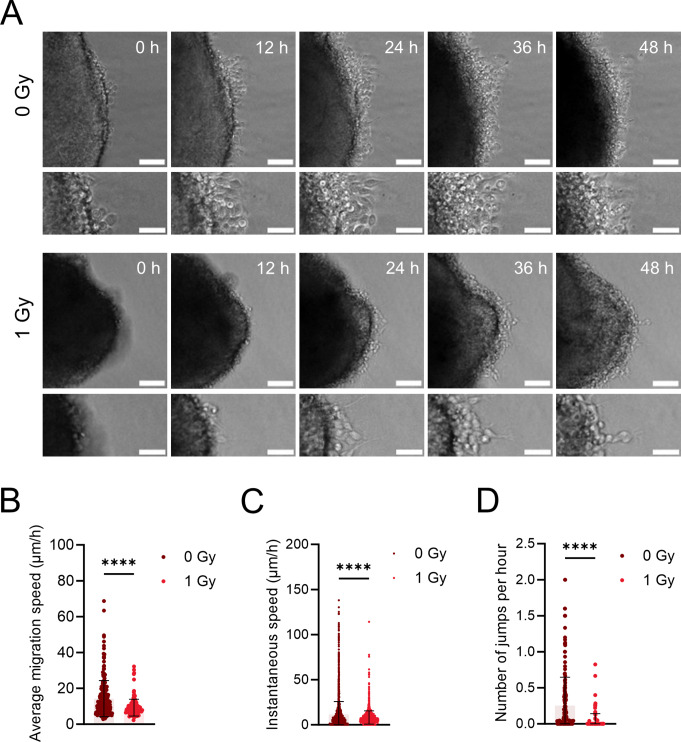
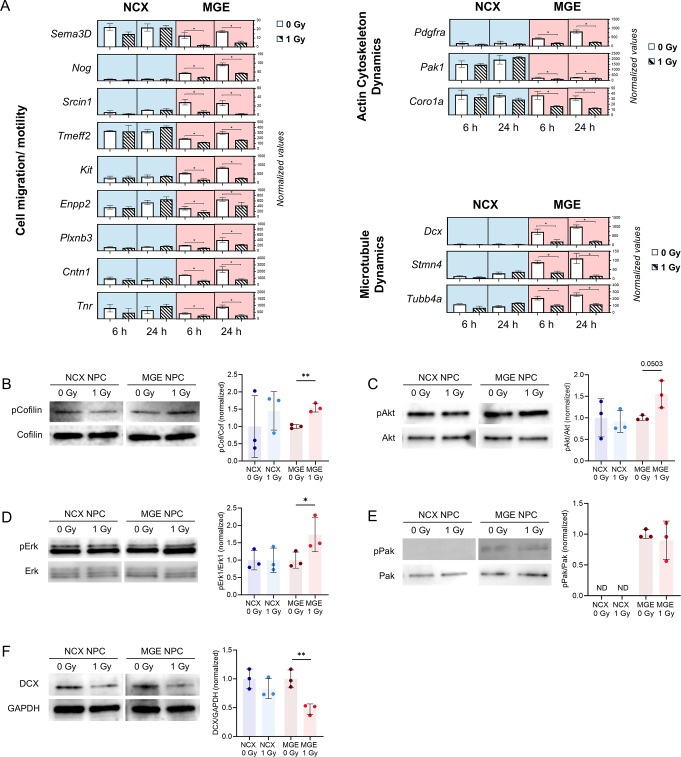
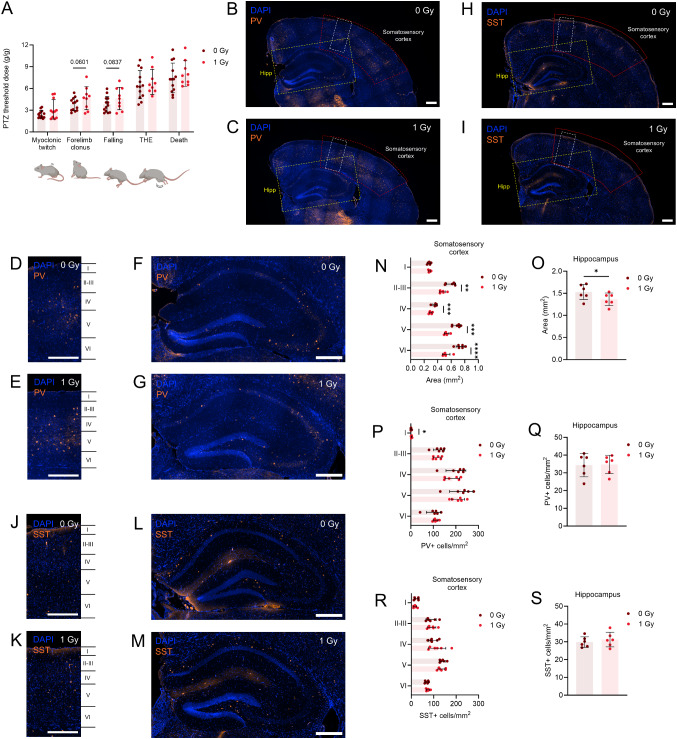
Embryonic DNA damage resulting from DNA repair deficiencies or exposure to ionizing radiation during early neurogenesis can lead to neurodevelopmental disorders, including microcephaly. This has been linked to an excessive DNA damage response in dorsal neural progenitor cells (NPCs), resulting in p53-dependent apoptosis and premature neuronal differentiation which culminates in depletion of the NPC pool. However, the effect of DNA damage on ventral forebrain NPCs, the origin of interneurons, remains unclear. In this study, we investigated the sequelae of irradiation of mouse fetuses at an early timepoint of forebrain neurogenesis. We focused on the neocortex (NCX) and medial ganglionic eminence (MGE), key regions for developing dorsal and ventral NPCs, respectively. Although both regions showed a typical p53-mediated DNA damage response consisting of cell cycle arrest, DNA repair and apoptosis, NCX cells displayed prolonged cell cycle arrest, while MGE cells exhibited more sustained apoptosis. Moreover, irradiation reduced the migration speed of interneurons in acute living brain slices and MGE explants, the latter indicating a cell-intrinsic component in the defect. RNA sequencing and protein analyses revealed disruptions in actin and microtubule cytoskeletal-related cellular machinery, particularly in MGE cells. Despite massive acute apoptosis and an obvious interneuron migration defect, prenatally irradiated animals did not show increased sensitivity to pentylenetetrazole-induced seizures, nor was there a reduction in cortical interneurons in young adult mice. This suggests a high plasticity of the developing brain to acute insults during early neurogenesis. Overall, our findings indicate that embryonic DNA damage induces region-specific responses, potentially linked to neurodevelopmental disorders.

Keywords: DNA damage; Interneuron migration; Microcephaly; Neurodevelopment; Seizures.


Conflict of interest statement

Declarations. Ethics approval: All procedures involving animals were in compliance with the Belgian laboratory animal legislation and the European Communities Council Directive (2010/63/EU), and approved by the local ethical committees at SCK CEN (Medanex Clinic, EC MxCl 2020 − 164), Hasselt University and Vrije Universiteit Brussel. Competing interests: The authors have no relevant financial or non-financial interests to disclose.

Figures

Fig. 1
Fig. 1
Prenatal irradiation triggers distinct and overlapping DNA damage responses in the NCX and MGE. (A, C, E) Immunostaining of DSB marker 53BP1 (A), late G2/M phase marker PH3 (C) and apoptosis marker CC3 (E) in NCX and MGE, 2 h (A, C) or 6 h (E) post-irradiation. (C) White arrowheads mark examples of cells in the M phase, while yellow arrowheads mark examples of cells in the late G2 phase. (B, D, F) Average 53BP1 foci/cell (B) and PH3-positive cells (G2/M) normalized to control (D), and percentage CC3-positive cells (F) in NCX and MGE of embryonic brains. n = 3–6. (G, I, K) Immunostaining of DSB markers 53BP1 and γH2AX (G), late G2/M phase marker PH3 (I) and apoptosis marker CC3 (K) in NCX and MGE primary cell cultures, 2 h (G, I) or 6 h (K) post-irradiation. (H, J, L) 53BP1/γH2AX spots/cell (H), PH3-positive cells (G2/M) (J) and CC3-positive cells (L) all relative to control, in NCX and MGE primary cell cultures. NCX NPCs_0 Gy: n/N53BP1/γH2AX = 4/320 (2 h), 4/414 (6 h), 4/259 (24 h); n/NPH3 = 4/425 (2 h), 4/298 (6 h), 4/569 (24 h); n/NCC3 = 4/529 (2 h), 4/394 (6 h), 4/372 (24 h); NCX NPCs_1 Gy: n/N53BP1/γH2AX = 4/486 (2 h), 4/267 (6 h), 4/167 (24 h); n/NPH3 = 4/763 (2 h), 4/383 (6 h), 4/407 (24 h); n/NCC3 = 4/484 (2 h), 4/307 (6 h), 4/703 (24 h); MGE NPCs_0 Gy: n/N53BP1/γH2AX = 3/1081 (2 h), 3/1958 (6 h), 3/1088 (24 h); n/NPH3 = 3/1216 (2 h), 3/1340 (6 h), 3/1683 (24 h); n/NCC3 = 3/1143 (2 h), 3/2085 (6 h), 3/1567 (24 h); and MGE NPCs_1 Gy: n/N53BP1/γH2AX = 3/1287 (2 h), 3/782 (6 h), 3/923 (24 h); n/NPH3 = 3/1208 (2 h), 3/1393 (6 h), 3/769 (24 h); n/NCC3 = 3/1327 (2 h), 3/1085 (6 h), 3/1049 (24 h). One-way ANOVA test followed by Tukey’s test for multiple comparisons, Kruskal-Wallis with Dunn’s test for multiple comparisons or Welch ANOVA test followed with Dunnett’s test for multiple comparisons was used. Scale bar = 50 μm
Fig. 2
Fig. 2
P53 governs the DNA damage response in the NCX and MGE. (A, C) Immunostaining of DSB marker 53BP1. Representative images of NCX and MGE of WT, cKO NCX and cKO MGE, 2 h post-irradiation at E11. (B, D) Average 53BP1 foci/cell in the NCX of WT and p53 cKO NCX embryonic brains (B) and MGE of WT and p53 cKO MGE embryonic brains (D). (E, G) Immunostaining of late G2/M phase marker PH3. Representative images of NCX and MGE of WT, cKO NCX and cKO MGE, 2 h post-irradiation at E11. (F, H) Relative amount of PH3-positive cells in G2- and M-phase (relative to control) in the apical zone of NCX of WT and p53 cKO NCX embryonic brains (F) and MGE of WT and p53 cKO MGE embryonic brains (H). (I, K) Immunostaining of apoptosis marker CC3. Representative images of NCX and MGE of WT, cKO NCX and cKO MGE, 2 h post-irradiation at E11. (J, L) Percentage CC3-positive cells in the NCX of WT and p53 cKO NCX embryonic brains (J) and MGE of WT and p53 cKO MGE embryonic brains (L). n = 3–6. One-way ANOVA test followed by Tukey’s test for multiple comparisons, Kruskal-Wallis with Dunn’s test for multiple comparisons or Welch ANOVA test followed with Dunnett’s test for multiple comparisons was used. Scale bar = 50 μm
Fig. 3
Fig. 3
Transcriptional profiling confirms a p53-dependent DNA damage response in MGE and NCX NPCs, 6 h post-irradiation. (A) Schematic illustration of the RNA-seq experimental design. Primary NCX and MGE cultures were exposed to 0 (sham) or 1 Gy of radiation. RNA was extracted at 6 and 24 h post-irradiation, and RNA-seq data were analyzed for differential gene expression (DE) across conditions. (B) (Left) Volcano plot of significant DEGs (FDR < 0.05) between 1 Gy irradiated and sham (0 Gy) NCX NPCs at 6 h post-irradiation. Upregulated DEGs in NCX are shown in light blue (n = 849), while downregulated DEGs are shown in dark blue (n = 734). (Right) Enrichment analysis of GO BP terms for upregulated and downregulated NCX DEGs 6 h post-irradiation, with relevant DEGs highlighted in the volcano plot on the left. (C) (Left) Volcano plot showing significantly upregulated (n = 831, light red) and downregulated (n = 561, dark red) DEGs (FDR < 0.05) between 1 Gy irradiated and sham (0 Gy) MGE NPCs at 6 h. (Right) Enrichment analysis of GO BP terms associated with upregulated and downregulated MGE DEGs 6 h post-irradiation. Relevant DEGs are highlighted in the volcano plot on the left
Fig. 4
Fig. 4
RNA-Seq highlights cellular migration as a uniquely downregulated process in MGE NPCs following irradiation. (A) Venn diagram showing the overlap among upregulated genes at different time points between two conditions, NCX and MGE. NCX-specific downregulated DEGs (6 and 24 h) are highlighted in blue (n = 155), and MGE-specific downregulated DEGs in red (n = 36). (B) Venn diagram illustrating the overlap between upregulated DEGs in NCX and MGE at both 6 and 24 h. NCX-specific downregulated DEGs (6 and 24 h) are highlighted in blue (n = 310), and MGE-specific downregulated DEGs in red (n = 97). (C) Comparative bar graphs showing significant enrichment of cell migration-related GO BP terms among MGE-specific downregulated genes (n = 97), which is not observed as enriched in NCX-specific downregulated genes (n = 310) following irradiation. GO BP terms related to migration process of the cells are highlighted in yellow. (D) Graph plots showing top transcription factors associated with NCX and MGE specific downregulated genes
Fig. 5
Fig. 5
Prenatal irradiation disrupts interneuron migration. Interneuron migration was evaluated using Nkx2.1 reporter mice (Nkx2.1eGFP/+) to properly distinguish eGFP-expressing interneurons in the embryonic brain. (AK) Half an hour prior to irradiation, pregnant dams were injected with BrdU enabling to distinguish between cells that were still proliferating at the time of irradiation and their progeny (GFP+/BrdU+) and cells that were already post-mitotic at that time (GFP+/BrdU). n = 3–4. Unpaired t-test or Mann-Whitney test was used. (A, E) DAPI and GFP/BrdU double staining of E13 and E15 sham (0 Gy)- and 1 Gy-irradiated brains. Scale bar = 200 μm (overview) and 50 μm (zoom-in). (B) Amount of DAPI-positive (DAPI+) cells in pallium-subpallium (P-SP) boundary of E13 embryos. (C, D) Amount of GFP+/BrdU+ cells and GFP+/BrdU corrected based on reduction in amount of DAPI + cells, in the migration streams (MZ, IZ) in the E13 P-SP. (F) Amount of DAPI + cells in the P-SP boundary of E15 embryos. (G, H) Amount of GFP+/BrdU+ cells and GFP+/BrdU corrected based on reduction in amount of DAPI + cells, in the migration streams (MZ, SP, IZ/SVZ) in the E15 P-SP boundary. (I) Amount of DAPI + cells in the cortex of E15 embryos. (J, K) Amount of GFP+/BrdU+ cells and GFP+/BrdU corrected based on reduction in amount of DAPI + cells, in the migration streams (MZ, SP, IZ/SVZ) in the E15 cortex. (L) Average migration speed of interneurons migrating in the MZ and IZ of E13.5 embryos. (M) Representative instantaneous speed in function of time of an interneuron migrating. Phases of active migration are interspersed with idling, defined as an instantaneous speed lower than a threshold of 0.8 μm/min (dotted line). (N) Instantaneous speed of the active (#) and idling (*) migration events of interneurons migrating in the MZ and IZ of E13.5 embryos. N = 100–227 cells from 3–6 embryos. Mann-Whitney test was used. IZ, intermediate zone; MZ, marginal zone; SP, subplate; SVZ, subventricular zone
Fig. 6
Fig. 6
Prenatal irradiation affects the intrinsic migration machinery of interneurons. (A, B) Representative migration tracks of migrating interneurons in MGE explants. Scale bar = 10 μm (overview) and 5 μm (zoom-in). (B, C) Average and instantaneous migration speed of interneurons migrating at MGE explant edge. (D) Number of ‘jumps’ >15 µm per hour of interneurons migrating at MGE explant edge. N = 157–238 cells from 11–12 explants. Mann-Whitney test was used
Fig. 7
Fig. 7
Irradiation affects regulatory components governing actin and microtubule dynamics in interneurons. (A) Normalized expression values of MGE-specific downregulated genes (6 and 24 h) associated with the regulation of cell migration and motility (left), as well as actin cytoskeleton (right top) and microtubule dynamics (right bottom). Statistical significance was determined using DESeq with FDR < 0.05. (BF) Expression of proteins (pCofilin/Cofilin, pAkt/Akt, pErk/Erk, pPak/Pak, DCX) involved in interneuron migration machinery in MGE and NCX primary cell culture. n = 3. Paired t-test or Wilcoxon test was used
Fig. 8
Fig. 8
Prenatal irradiation leaves seizure susceptibility and interneuron positioning unharmed in the young adult brain. (A) Histogram of seizure-related behavioral alterations (Racine score) following pentylenetetrazol (PTZ) injection in P56 offspring of sham- and 1 Gy-irradiated dams. n = 11–13. Unpaired t-test or Mann-Whitney test was used. (B, C) Immunostaining of interneuron subtype marker parvalbumin (PV) in the P56 brain. The red area outlines the somatosensory cortex, the yellow box highlights the hippocampus. (D–G) Representative images of PV staining in P56 somatosensory cortex (D, E) and hippocampus (F, G). (H, I) Immunostaining of interneuron subtype marker somatostatin (SST) in the P56 brain. The red area outlines the somatosensory cortex, the yellow box highlights the hippocampus. (J–M) Representative images of SST staining in P56 somatosensory cortex (J, K) and hippocampus (L, M). (N, O) Area of cortical layers I, II-III, IV, V, VI in the somatosensory cortex (N) and hippocampus (O) of P56 offspring of dams which received sham- or 1 Gy-irradiation. (P–S) Number of PV-positive (+) (P, Q) or SST+ (R, S) interneurons in the somatosensory cortex and hippocampus of P56 offspring. Scale bar = 300 μm. n = 6. Unpaired t-test or Mann-Whitney test was used. Hipp, hippocampus; PV, parvalbumin; SST, somatostatin

Similar articles

Cited by

References

    1. McKinnon PJ (2017) Genome integrity and disease prevention in the nervous system. Genes Dev 31:1180–1194 - PMC - PubMed
    1. Verreet T, Verslegers M, Quintens R, Baatout S, Benotmane MA (2016) Current evidence for developmental, structural, and functional brain defects following prenatal radiation exposure. Neural Plast 2016:1243527 - PMC - PubMed
    1. Dunn K, Yoshimaru H, Otake M, Annegers JF, Schull WJ (1990) Prenatal exposure to ionizing radiation and subsequent development of seizures. Am J Epidemiol 131:114–123 - PubMed
    1. Lin DD, Roper SN (2017) Chap. 58 - Utero irradiation as a model of cortical dysplasia. In: Pitkänen A, Buckmaster PS, Galanopoulou AS, Moshé SL (Eds.) Models of seizures and epilepsy (2nd edn). Academic Press, pp 877–885
    1. Miller MW (1996) Effect of early exposure to ethanol on the protein and DNA contents of specific brain regions in the rat. Brain Res 734:286–294 - PubMed

MeSH terms

Substances

LinkOut - more resources