. 2025 Mar 17;21(3):e1012363.
doi: 10.1371/journal.ppat.1012363. eCollection 2025 Mar.

Adiponectin pathway activation dampens inflammation and enhances alveolar macrophage fungal killing via LC3-associated phagocytosis

Affiliations

Adiponectin pathway activation dampens inflammation and enhances alveolar macrophage fungal killing via LC3-associated phagocytosis

Sri Harshini Goli et al. PLoS Pathog. .

Abstract

Although innate immunity is critical for antifungal host defense against the human opportunistic fungal pathogen Aspergillus fumigatus, potentially damaging inflammation must be controlled. Adiponectin (APN) is an adipokine produced mainly in adipose tissue that exerts anti-inflammatory effects in adipose-distal tissues such as the lung. We observed increased mortality and increased fungal burden and inflammation in neutropenic mice with invasive aspergillosis (IA) that lack APN or the APN receptors AdipoR1 or AdipoR2. Alveolar macrophages (AMs), early immune sentinels that detect and respond to lung infection, express both receptors, and APN-deficient AMs exhibited an inflammatory phenotype that was associated with decreased fungal killing. Pharmacological stimulation of AMs with AdipoR agonist AdipoRon rescued deficient killing in APN-/- AMs and was dependent on the presence of either receptor. Finally, APN-enhanced fungal killing was associated with increased activation of the non-canonical LC3 pathway of autophagy. Thus, our study identifies a novel role for APN in LC3-mediated killing of A.fumigatus.


Conflict of interest statement

The authors have declared that no competing interests exist.

Figures
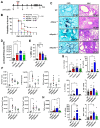
Fig 1
Fig 1. Increased mortality, fungal burden, and inflammation in APN pathway-deficient mice with invasive aspergillosis.
Wild-type (C57BL/6), Adipoq−/−, AdipoR1−/−, and AdipoR2−/− mice were neutrophil-depleted and involuntarily aspirated a suspension of A. fumigatus conidia and followed for survival or sacrificed on day 3 post-infection as described in Materials and Methods. A. Timeline for neutropenic mouse model of infection. B. Survival. C. Representative GMS and H&E lung sections. D. Fungal burden determined by quantitative PCR of fungal DNA from lung homogenates. E. Fungal burden determined by quantification of GMS staining. F. Total number of CD45+ cells, eosinophils (CD45+Ly6GCD11cSiglecF+), AMs (CD45+Ly6GCD11c+SiglecF+), CD11c+SiglecF (CD45+Ly6G CD11c+SiglecF), and CD11cSiglecF (CD45+Ly6GCD11cSiglecF) cells isolated from the mice with IA as determined by flow cytometry. G. qRT-PCR analysis for mRNA expression of the indicated cytokines. H. TNFα secretion in BALF quantified by ELISA. Data are a summary of two independent experiments. *p < 0.05, **p < 0.01, ***p < 0.001.
Fig 2
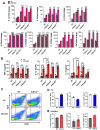
Fig 2. Alveolar macrophages from APN pathway-deficient mice exhibit an inflammatory phenotype.
BALF cells from wild-type (C57BL/6), Adipoq−/−, AdipoR1−/−, and AdipoR2−/− mice were collected in PBS/EDTA. For alveolar macrophage differentiation, total BALF cells were plated and cultured with GM-CSF. Alveolar macrophages were challenged with conidia in the ratio 1:9 (AMs: conidia) for 10 hours duration as per the details mentioned in Materials and Methods. A. qRT-PCR analysis for mRNA expression of the indicated cytokines. B. The indicated cytokines are quantified at the protein level by ELISA using ex vivo cultured alveolar macrophages. C. Flow cytometry staining of surface CD38 and intracellular Egr2. D-E. Quantification of (C), showing the proportion of M1, M2 and CD38+Egr2+ macrophages with CD38+Egr2 (classical, inflammatory) or CD38Egr2+ (alternative) phenotype in control group (D) and infection group (E). Data are a summary of two independently performed experiments. An asterisk (*) indicates a significant difference versus corresponding non-infected controls. A hash (#) indicates a significant difference between non-infected (NI) groups versus NI WT. A dagger (†) indicates a significant difference between infected groups versus infected WT. *p < 0.05, **p < 0.01, ***p < 0.001.
Fig 3
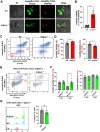
Fig 3. A. fumigatus conidial uptake and killing are inhibited in adiponectin-deficient AMs.
AMs from wild-type or Adipoq-/- mice were infected ex vivo with FLARE conidia, or neutropenic mice were infected with FLARE conidia or exposed to latex beads in vivo and isolated as described in Materials and Methods. A. Microscopic analysis of uptake and killing of FLARE conidia with magnification 40x is depicted in Brightfield, Cy5, DsRed channels followed by the merged image. Scale bar is equal to 12 µm. B. Quantification of Aspergillus viability using microscopy images via calculation of co-localization in imageJ. C. Representative plots that display RFP and AF633 fluorescence intensity of ex vivo cultured alveolar macrophages where R1 represents live conidia inside the alveolar macrophages and R2 represents dead/killed conidia. D. Quantification of (C), showing Aspergillus viability (R1/(R1 + R2), left panel) and uptake (R1 + R2, right panel) in ex vivo cultured alveolar macrophages. E. Representative plots that display RFP and AF633 fluorescence intensity of AMs (CD45+Ly6GCD11c+SiglecF+) in vivo. Mice of both groups were made immunocompromised and infected with 1-1.5 × 10⁷ conidia. BAL cells were harvested 1 day and 3 days later. F. Quantification of (E), showing Aspergillus viability (R1/(R1 + R2)) and uptake (R1 + R2) in alveolar macrophages in neutropenic mice at d1 and d3 p.i. G. Fluorescent particle uptake by alveolar macrophages in vivo. For flow cytometric analysis, neutrophil-depleted mice were challenged with 1.5 × 10⁷ of flow particles. Percentage of flow particle positive (FP+) cells was assessed in AMs (CD45+Ly6GCD11c+SiglecF+) from the wild-type and Adipoq−/− mice by flow cytometry. Data are a summary of two independent experiments. *p < 0.05, **p < 0.01, ***p < 0.001.
Fig 4
Fig 4. The AdipoR agonist AdipoRon decreases inflammation and fungal burden in APN-deficient mice with IA.
Wild-type (C57BL/6), and Adipoq−/− mice were neutrophil depleted and involuntarily aspirated A. fumigatus conidia as described in Materials and Methods. A. Time course for neutropenic mouse model of infection and AdipoRon treatment. B. Effect of AdipoRon on the survival rate of WT and Adipoq−/− mice. C. Representative GMS and H&E lung sections. D. Fungal burden determined by quantitative PCR of fungal DNA from lung homogenates. E. Fungal burden determined by quantification of GMS staining. F. Total number of CD45+ cells, eosinophils, AMs, CD11c+SiglecF, and CD11cSiglecF cells isolated from the mice with IA as determined by flow cytometry. G. qRT-PCR analysis for mRNA expression of the indicated cytokines. H. TNF secretion in BALF quantified at the protein level by ELISA. Data are a summary of 2-3 independently performed experiments. *p < 0.05, **p < 0.01, ***p < 0.001.
Fig 5
Fig 5. AdipoRon increases AdipoR-dependent AM fungal killing and reverses inflammatory phenotype.
Wild-type or APN pathway-deficient AMs were infected and treated with AdipoRon or vehicle to determine the effect of AdipoRon on fungal killing, cytokine transcription and secretion as described in Materials and Methods. A. Timeline for ex vivo cultured AMs challenged with conidia with or without AdipoRon treatment. B. Microscopic image quantification of Aspergillus viability (R1/(R1 + R2)) in ex vivo cultured AMs by using FLARE conidia. The infection was done ex-vivo in 1:1 ratio (AMs: FLARE) for 15 hours. C. Flow cytometric quantification of Aspergillus viability. D. qRT-PCR analysis for mRNA expression of the indicated cytokines. Differences between experimental groups that resulted in a p value < 0.05 were considered significant. An asterisk (*) indicates a significant difference versus corresponding non-infected controls. A hash (#) indicates a significant difference between WT versus KO mice in vehicle groups. A dagger (†) indicates a significant difference between WT groups versus KO mice in AdipoRon-treated groups. E. TNF, IL-1a, and IL-6 secretion quantified at the protein level using ex vivo cultured AMs by ELISA. Data are a summary of two independently performed experiments. *p < 0.05, **p < 0.01, ***p < 0.001.
Fig 6
Fig 6. AdipoRon-enhanced killing of A. fumigatus requires either AdipoR1 or AdipoR2.
AMs from Wild-type or APN pathway deficient AMs were treated with AdipoR1 siRNA and/or AdipoRon, then infected with FLARE conidia to determine the effect on and requirement for AdipoR expression in stimulation of fungal killing as described in Materials and Methods. A. Timeline for primary AM cultures treated with AdipoR1 siRNA, details in Materials and Methods section. B. Histogram graphs obtained from flow cytometry analysis at 72 hours post siRNA treatment. The positive control represents the ideal Adipor1 knockdown control, while the negative control is in the absence of functional siRNA. C. MFI AdipoR1 is graphed from negative control, sample and positive control from flow cytometric analysis. D. qRT-PCR analysis for mRNA expression of the Adipor1 in AMs from the APN-deficient mice with siRNA treatment. E. Conidial viability (R1/(R1 + R2)) in ex vivo cultured AMs with siRNA and/or AdipoRon by flow cytometry. Data are a summary of two independently performed experiments. **p < 0.01 and ***p < 0.001.
Fig 7
Fig 7. Adiponectin promotes LC3-associated phagocytosis of A. fumigatus conidia.
Wild-type or Adipoq-/- AMs were treated or vehicle-treated and infected with AF293 or DS-Red+ conidia and stained for LC3 and DAPI to determine the effect of AdipoRon on AM phagosomal LC3 expression. A. Timeline for LC3-associated phagocytosis analysis. B. Microscopy of LAP-dsRed conidia and LC3+ AMs at a magnification of 20X in ex vivo cultured AMs from infected WT and Adipoq−/− mice with or without AdipoRon. The images from DsRed, FITC, DAPI channels are presented followed by the merged image. Scale bar: 35µm. C. Microscopic quantification of LC3+ phagosome (%) in ex vivo cultured AMs from infected WT and Adipoq−/− mice with or without AdipoRon. D. The mean fluorescent intensity (MFI) obtained by flow cytometry indicates the expression level of LC3-AF488 in ex vivo cultured AMs from infected WT and Adipoq−/− mice with or without AdipoRon. Data are a summary of two independently performed experiments. *p < 0.05 and ***p < 0.001.

Update of

References

    1. van de Veerdonk FL, Gresnigt MS, Romani L, Netea MG, Latgé J-P. Aspergillus fumigatus morphology and dynamic host interactions. Nat Rev Microbiol. 2017;15(11):661–74. doi: 10.1038/nrmicro.2017.90 - DOI - PubMed
    1. Carvalho A, Cunha C, Iannitti RG, De Luca A, Giovannini G, Bistoni F, et al.. Inflammation in aspergillosis: the good, the bad, and the therapeutic. Ann N Y Acad Sci. 2012;1273:52–9. doi: 10.1111/j.1749-6632.2012.06754.x - DOI - PubMed
    1. Sprenkeler EGG, Gresnigt MS, van de Veerdonk FL. LC3-associated phagocytosis: a crucial mechanism for antifungal host defence against Aspergillus fumigatus. Cell Microbiol. 2016;18(9):1208–16. doi: 10.1111/cmi.12616 - DOI - PubMed
    1. Hoffstedt J, Arvidsson E, Sjölin E, Wåhlén K, Arner P. Adipose tissue adiponectin production and adiponectin serum concentration in human obesity and insulin resistance. J Clin Endocrinol Metab. 2004;89(3):1391–6. doi: 10.1210/jc.2003-031458 - DOI - PubMed
    1. Ren Y, Zhao H, Yin C, Lan X, Wu L, Du X, et al.. adipokines, hepatokines and myokines: focus on their role and molecular mechanisms in adipose tissue inflammation. Front Endocrinol (Lausanne). 2022;13:873699. doi: 10.3389/fendo.2022.873699 - DOI - PMC - PubMed

MeSH terms

LinkOut - more resources