. 2025 Mar 17;15(1):82.
doi: 10.1038/s41398-025-03271-0.

Chemogenetic induction of CA1 hyperexcitability triggers indistinguishable autistic traits in asymptomatic mice differing in Ambra1 expression and sex

Affiliations

Chemogenetic induction of CA1 hyperexcitability triggers indistinguishable autistic traits in asymptomatic mice differing in Ambra1 expression and sex

Margherita De Introna et al. Transl Psychiatry. .

Abstract

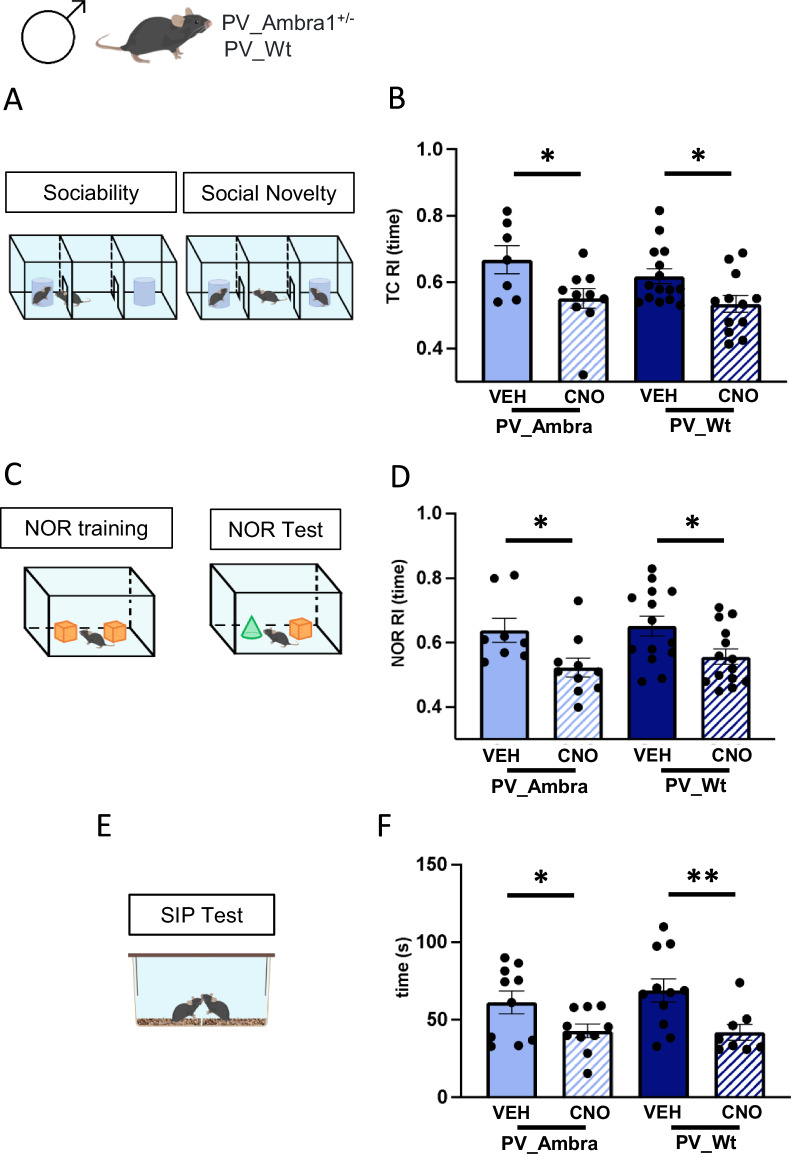
Among the genomic alterations identified as risk factors in mice models of autism spectrum disorders (ASD), heterozygous deletion of Ambra1 (Activating Molecule in Beclin1-Regulated Autophagy) triggers an ASD phenotype associated with hippocampal hyperexcitability exclusively in the female sex although Ambra1 protein is comparably expressed in the hippocampus of symptomatic females and asymptomatic males. Given the intricate relationship between Ambra1 deficiency and sex in the etiology of ASD, we took advantage of asymptomatic mice including Ambra1+/- males and wild-type (Wt) mice of both sexes to investigate whether their non-pathogenic variations in Ambra1 levels could underlie a differential susceptibility to exhibit ASD-like traits in response to experimental elevation of hippocampal excitability. Here we report that selective activation of inhibitory DREADD in CA1 parvalbumin-positive interneurons (PV-IN) reduces GABAergic currents onto pyramidal neurons (PN), causes social and attentional deficits, and augments the proportion of immature/thin spines in CA1 PN dendrites to the same extent in Ambra1+/- males and Wt mice of both sexes. Our findings show that the substantial hippocampal variations in pro-autophagic Ambra1 gene product shown by asymptomatic mice differing in mutation and/or sex do not underlie a differential reactivity to chemogenetic induction of idiopathic ASD.


Conflict of interest statement

Competing interests: The authors declare no competing interests. Ethics approval: All methods were conducted in strict accordance with relevant guidelines and regulations. Approval for all study-specific experiments and procedures was obtained from the Italian Ministry of Health (Art. 31, D. Lgs 26/2014) based on the ethical guidelines established by the European Council Directive (2010/63/EU). The animal protocol was authorized under permit No. 357/2018-PR.

Figures

Fig. 1
Fig. 1. PV_Ambra1+/− mice show sex-specific Ambra1 protein reduction and selective DREADD expression in CA1 PV interneurons.
A Breeding. B Representative western blots from PV_Wt and PV_A female and male hippocampi. C Box and whisker plots show hippocampal levels of Ambra1 protein expression in the four experimental groups. Data are expressed as % of Ambra1 levels from PV_Wt females, normalized to Actin. 2-way ANOVA shows an effect of genotype (F(1, 27) = 38.02, P < 1 × 10−4), sex (F(1, 27) = 8.76, P = 0.006, and of genotype x sex interaction (F(1, 27) = 4.39, P = 0.04). Ambra1 was constitutively more expressed in PV_Wt females (n = 7) than PV_Wt males (n = 7), P < 0.05, and significantly decreased in PV_A females (n = 9) compared to both PV_Wt females (P < 1 × 10−4)) and PV_Wt males (P = 0.010). Ambra1 was also significantly decreased in PV_A males (n = 8) compared to PV-Wt males (P = 0.040) but similarly expressed in PV_A males and PV_A females (Tukey’s test post hoc pair comparisons). D Box and whisker plots depicting the percentage reduction of Ambra1 expression from constitutive levels in PV_A mice of both sexes. Downregulation of Ambra1 expression was significantly stronger in PV_A females than PV_A males (P < 0.01). E Experimental design: AAV-hSyn-DIO-hM4Di-mCherry was bilaterally inoculated in the dorsal hippocampal CA1 region. Experiments started four weeks later. Vehicle (VEH) or CNO were injected i.p. 40 min before behavioral testing and electrophysiological recordings, or diluted at the same concentration in the drinking water 24 h before mice were sacrificed for dendritic spine analyses. F Left panel: low magnification image depicting in situ stereotaxic inoculation of AAV-hSyn-DIO-hM4Di-mCherry in dorsal CA1 hippocampus, scale bar: 50 μm. Right panels: representative images of CA1 NeuroTrace/PV/mCherry labeling showing overlapping signals (yellow) of mCherry (red) and Parvalbumin interneurons (PV-IN) (green). Scale bar: 20 μm. G Percentage estimation of PV-IN infected with the hM4Di AAV (PV+mCherry+/total PV+). In box-and-whisker plots, the central line denotes median value, edges are upper and lower quartiles, whiskers show minimum and maximum values. Points are individual experiments (N = 6 for hM4Di). Data are plotted as mean ± s.e.m. Post hoc pair comparisons *P < 0.05, **P < 0.01, ***P < 0.001.
Fig. 2
Fig. 2. Chemogenetic inhibition of PV-IN in Ambra1+/− and Wt male mice reduces GABAergic currents onto CA1 PN.
A The traces show eIPSCs before and after bath application of CNO (10 μM), from CA1 PNs (held at −70 mV) from PV_A male mice inoculated with AAV-hSyn-DIO-hM4Di-mCherry. The left plot shows the input-output relationship of eIPSCs at different stimulation intensities (n = 9 neurons, 2-way (repeated stimulus x treatment) ANOVA; interaction F(5,40) = 7.33, P = 1 × 10−4; stimulus F(5,80) = 21.88, P < 1 × 10−4; treatment F(1,8) = 5.77, P = 0.043 with Bonferonni’s post-hoc test). The right plot shows the effect of CNO on eIPSC amplitude at half-maximal stimulation. The gray panel shows the duration of CNO application (n = 10 neurons, *P = 0.032 with paired t-test). B Traces show paired recordings of miniature IPSCs (mIPSCs) before and after bath application of CNO (10 μM) from PV_A males inoculated with AAV-hSyn-DIO-hM4Di-mCherry. The plots show cumulative probability plots for inter-event interval and peak amplitude (9 neurons, inter-event interval P < 0.0001, peak P < 0.0001 with Kolmogorov-Smirnov test). C Paired eIPSCs before and after bath application of CNO from PV_Wt males inoculated with AAV-hSyn-DIO-hM4Di-mCherry. The left plot shows the input-output relationship of eIPSCs at different stimulation intensities (n = 8 neurons, 2-way RM-ANOVA, Interaction F(4,28) = 3.06. P = 0.033, stimulus F(4,28) = 10.37, P < 1 × 10−4; treatment F(1,7) = 6.31; P = 0.040, pair comparisons **P = 0.001, *P = 0.029, ***P = 7 × 10−4 with Bonferonni’s test). The right plot shows the effect of CNO on eIPSC amplitude at half-maximal stimulation (n = 11 neurons, *P = 0.009 with paired t-test). D mIPSCs before and after bath application of CNO (10 μM), from PV_Wt inoculated with AAV-hSyn-DIO-hM4Di-mCherry. The plots show cumulative probability plots for inter-event interval and peak amplitude (7 neurons, inter-event interval P = 0.0601, peak P < 0.0001 with Kolmogorov-Smirnov test). A–D. The effect of CNO showed similarity between PV_A males and PV_Wt males. Specifically, there is no discernible variance in genotype effects between PV_A males and PV_Wt males, evident in the delta reduction of eIPSC [t(18,8) = 0.65, P = 0.5244] (A, C), and neither in the frequency nor in the amplitude [Two-way ANOVA repeated measures: frequency: genotype effect = ns, F(1,14) = 0.64, P = 0.44; amplitude: genotype effect: ns, F(1, 14) = 0.3, P = 0.6] (B, D).
Fig. 3
Fig. 3. Acute chemogenetic inhibition of PV-IN triggers social and attentional deficit in male mice regardless of mutation.
A Three-chamber (TC) test protocol. B Histograms show mean value of the recognition index (RI) calculated in the social novelty phase of the TC test in PV_A and PV_Wt males injected with vehicle (VEH) or CNO. Reactivity to social novelty was significantly impaired in CNO-injected mice regardless of genotype [2-way ANOVA, treatment: F(1,40) = 11.5 P = 0.002, genotype: ns; PV_A/CNO (n = 10) vs PV_A/VEH (n = 7), P = 0.016; PV_Wt/CNO (n = 12) vs PV_Wt/VEH (n = 15), P = 0.021 with Fisher LSD post hoc test. C Novel object recognition (NOR) protocol. D Histograms show mean value of RI calculated in the NOR test phase in same groups. Novel object recognition was impaired in CNO-injected mice regardless of genotype [treatment: F(1,42) = 11.62, P = 0.001, genotype: ns; PV_A/CNO (n = 10) vs PV_A/VEH (n = 8), P = 0.021; PV_Wt/CNO (n = 14) vs PV_Wt /VEH (n = 14), P = 0.017 with Fisher LSD post hoc test]. E Social interaction in pair (SIP) protocol. F Histograms show mean time spent exploring a stranger age-matched mouse during the SIP test. Social interactions were decreased in CNO-injected mice regardless of genotype [treatment: F(1,35) = 11.85, P = 0.002, genotype: ns; PV_A/CNO (n = 10) vs PV_A/VEH (n = 10), P = 0.05; PV_Wt/CNO (n = 8) vs PV_Wt/VEH (n = 11), P < 0.01 with Fisher LSD post hoc test]. Data are plotted as mean ± s.e.m. *P < 0.05, **P < 0.01.
Fig. 4
Fig. 4. Prolonged chemogenetic inhibition of PV-IN triggers ASD-typical hippocampal spine dysgenesis in male mice regardless of mutation.
A Representative Golgi-stained dorsal hippocampal section from a male Wt control mouse. Left panels: area of dendritic spines measurement (5x magnification, scale bar: 250 μm; 20x magnification, scale bar: 50 μm). Right panels: dendritic spines magnification (100×, scale bar: 5 μm) and zoom of the same sections. B Histograms show mean spine density counted in PV_A and PV_Wt males expressed as fold change of CNO-drinking groups from vehicle (VEH)-drinking goups [PV_A/VEH (17 neurons), PV_A/CNO (33 neurons), PV:Wt/VEH (24 neurons), PV_Wt/CNO (32 neurons)]. Spine density was increased in CNO-drinking mice regardless of genotype [2-way ANOVA, treatment: F(1,102) = 13.78, P = 0.0001, genotype: ns; PV_A/VEH vs PV_A/CNO, P = 0.006; PV_Wt/VEH vs PV_Wt/CNO, P = 0.01; PV_A/CNO vs PV_Wt/CNO, ns]. C Enlarged 100× magnification of a representative dendritic segment (23,57 μm) from a CA1 pyramidal neuron. Pink arrows indicate mushroom spines and blue arrows thin spines. Below, the skeleton of the same dendritic segment with the visualization of the length and head diameter for each spine category. This image has undergone post-production and stack merging with various focus points. Being exclusively designed to enhance clarity of the classification method, it does not depict spines counted in any experimental subject. D, E Histograms show the percentage of thin (D) and mushroom (E) spines in the four experimental groups [PV_A/VEH (3 mice, 6 neurons, 23 segments), PV_A males/CNO (4 mice, 8 neurons, 31 segments), PV_Wt/VEH (3 mice, 6 neurons, 25 segments), PV_Wt/CNO (3 mice, 6 neurons, 24 segments)]. Thin spines were increased, and mushroom spines decreased, in CNO-drinking mice regardless of genotype [Thin spines: treatment F(1,99) = 11.65, P = 0.001, genotype (ns); PV_A/VEH vs PV_A/CNO, P = 0.01; PV_Wt/VEH vs PV_Wt/CNO, P = 0.02; Mushroom spines: treatment F(1,99) = 30.95, P = 0.0001, genotype (ns); PV_A/VEH vs PV_A/CNO, P = 0.005 ; PV_Wt/VEH vs PV_Wt/CNO, P = 0.0001]. Data are expressed as mean ± s.e.m. LSD Fisher post hoc pair comparisons, *P < 0.05, **P < 0.01, *** P < 0.001.
Fig. 5
Fig. 5. Chemogenetic inhibition of PV-IN in Wt females recapitulates the autistic phenotype of CNO-injected Wt males.
A The traces show eIPSCs before and after bath application of CNO (10 μM), from CA1 pyramidal neurons (held at −70 mV) from PV_Wt females inoculated with AAV-hSyn-DIO-hM4Di-mCherry. The left plot shows the input-output relationship of eIPSCs at different stimulation intensities (n = 8 neurons, 2-way ANOVA, Interaction, F(4,28) = 2.02, P = 0.119; stimulus F(4,28) = 11.64, P < 1 × 10−4; treatment F(1,7) = 3.51, P = 0.011 with Bonferonni’s post-hoc test). The right plot shows the effect of CNO on eIPSC amplitude at half-maximal stimulation. The grey panel shows the duration of CNO application (n = 9 neurons, P = 0.012 with Wilcoxon matched-pairs test). B Traces show paired recordings of mIPSCs before and after bath application of CNO (10 μM) from PV_Wt females injected with AAV-hSyn-DIO-hM4Di-mCherry. The plots show cumulative probability plots for inter-event interval and peak amplitude (7 neurons, inter-event interval P < 0.0001, peak P < 0.0001 with Kolmogorov-Smirnov test). A, B. The impact of CNO treatment was analogous in PV_Wt females and PV_Wt males. No significant variations are detected between sexes in A delta reduction of eIPSC [t(16) = 0.8, P = 0.45], B frequency and amplitude [Two-way ANOVA repeated measures: frequency: effect of sex = ns, F(1, 12) = 9.157, P = 0.56; amplitude: effect of sex = ns, F(1, 12) = 1.604, P = 0.23 between PV_Wt females and PV_Wt males. C Histograms show the mean recognition index (RI) calculated during the social novelty phase of the TC test. The blue line represents scores of PV_Wt male mice. PV_Wt/CNO females (n = 6) show social novelty impairments compared to PV_Wt/VEH females (n = 8) [treatment: F(1, 37) = 10.72, P = 0.002. PV_Wt/CNO vs PV_Wt/VEH females, P = 0.03 with Fisher LSD post hoc test]. Of note, no effect of sex was reported [sex: F(1, 37) = 0.99, P = 0.326]. D Histograms show the mean recognition index (RI) calculated during the NOR test phase. The blue line represents scores of PV_Wt males. Novel object recognition was impaired in PV_Wt/CNO females (n = 6) compared to PV-Wt/VEH females (n = 7), [treatment: F(1, 37) = 10.28, P = 0.003; PV_Wt/CNO (n = 6) vs PV_Wt/VEH (n = 7) females, P = 0.04 with Fisher LSD post hoc test]. Of note, no effect of sex was reported [sex: F(1, 37) = 0.42, P = 0.5]. E Histograms show the mean time spent exploring an unknown female conspecific during the social interaction in pair test (SIP). The blue lines represent scores of PV_Wt males. PV_Wt/CNO females show less social interactions than PV_Wt/VEH females. [treatment: F(1, 33) = 14.48, P = 0.001; PV_Wt/CNO (n = 10) vs PV_Wt/VEH (n = 8) females, P = 0.04 with Fisher LSD post hoc test]. Males show more sociality than females [sex: F(1, 33) = 19.53, P < 0.001; PV_Wt/VEH females vs PV_Wt/VEH males, P < 0.001; PV_Wt/CNO females vs PV_Wt/CNO males, P = 0.03. F Box and whisker plots depicting the relative reduction in exploration time induced by CNO in PV_Wt females and PV_Wt males. No differences are detected between the two groups t(16) = 0.7, P = 0.5. G Representative dendrites obtained from a Golgi-stained dorsal hippocampal section in a Wt control female. On the left, 100× magnifications (scale bar: 5 μm) with zoom of the same sections on the right. H Histograms show the mean spine density in PV_Wt females exposed to CNO, expressed as fold change from vehicle (VEH). The blue lines represent scores of PV_Wt males. CNO-drinking Wt females showed an increase in spine density compared to VEH-drinking females [PV_Wt/VEH (20 neurons), PV_Wt/CNO (23 neurons); treatment: F(1, 95) = 14.58, P < 0.001; PV_Wt/CNO vs PV_Wt/VEH females, P = 0.007 with Fisher LSD post hoc test]. No effect of sex was found [sex: F(1, 95) = 0.08, P = 0.77]. I, J Histograms show the percentage of thin I and mushroom J spines in the same groups [PV_Wt/VEH females (4 mice, 9 neurons; 39 segments); PV_Wt/CNO females (3 mice, 5 neurons, 24 segments)]. CNO-drinking PV-Wt females showed an increase in thin spines, and a decrease in mushroom spines, compared to VEH-drinking PV_Wt females [Thin spines: treatment: F(1, 108) = 11.4, P = 0.001; PV_Wt/CNO vs PV_Wt/VEH females, P = 0.034 with Fisher LSD post hoc test]. No effect of sex was reported [sex: F(1, 108) = 0.99, P = 0,3]. Mushroom spines: F(1, 108) = 39.98, P < 0.001; PV_Wt/CNO vs PV_Wt/VEH females, P < 0.001 with Fisher LSD post hoc test]. No effect of sex was found [sex: F(1,108) = 1.44, P = 0.2]. Data are expressed as mean ± s.e.m. *P < 0.05, **P < 0.01, *** P < 0.001.
Fig. 6
Fig. 6. Chemogenetic increase of CA1 PN activity replicates social and NOR impairments produced by chemogenetic decrease of CA1 PV-IN activity.
A Breeding. B Representative images of NeuroTrace/CamKII/mCherry labeling showing overlapping signals of mCherry (red) and CamKII- neurons (green). hM3Dq receptors are selectively expressed in CA1 principal neurons. Scale bars: top, 200 μm; below, 50 μm. C Experimental design: the rAAV5/CaMKIIa-hM3D(Gq)-mCherry vector was bilaterally inoculated in the dorsal CA1 region of Ambra1+/− males and Wt mice of both sexes. Behavioral tests were performed 4 weeks later. Vehicle (VEH) or CNO were injected i.p. 40 min before testing. D Histograms show the mean recognition index (RI) calculated in the social novelty phase of the TC test. Reactivity to social novelty was impaired in CNO-injected mice regardless of group [2-way ANOVA, treatment: F(1,34) = 24.9, P = 0.001. Group: ns; A/VEH males (n = 6) vs A/CNO (n = 6) males, P = 0.002; Wt/VEH males (n = 8) vs Wt/CNO males (n = 7), P = 0.02; Wt/VEH females (n = 8) vs Wt/CNO females (n = 5), P = 0.004 with Fisher LSD post hoc test]. E Plots show the mean recognition index (RI) calculated in the NOR test phase. Novel object recognition was impaired in CNO-injected mice regardless of group [treatment: F(1,33) = 17.84, P = 0.001, Group: ns; A/Veh males (n = 8) vs A/CNO males (n = 6), P = 0.01; Wt/VEH males (n = 7) vs Wt/CNO males (n = 6), P = 0.01; Wt/VEH females (n = 7) vs Wt/CNO females (n = 5), P = 0.05]. Data are expressed as mean ± s.e.m. *P < 0.05, **P < 0.01, ***P < 0.001.

References

    1. Hodges H, Fealko C, Soares N. Autism spectrum disorder: definition, epidemiology, causes, and clinical evaluation. Transl Pediatr. 2020;9:S55–S65. - PMC - PubMed
    1. Wang L, Wang B, Wu C, Wang J, Sun M. Autism spectrum disorder: neurodevelopmental risk factors, biological mechanism, and precision therapy. Int J Mol Sci. 2023;24:1819. - PMC - PubMed
    1. Ajram LA, Pereira AC, Durieux AMS, Velthius HE, Petrinovic MM, McAlonan GM. The contribution of [1H] magnetic resonance spectroscopy to the study of excitation-inhibition in autism. Prog Neuropsychopharmacol Biol Psychiatry. 2019;89:236–44. - PubMed
    1. Lee E, Lee J, Kim E. Excitation/inhibition imbalance in animal models of autism spectrum disorders. Biol Psychiatry. 2017;81:838–47. - PubMed
    1. Takarae Y, Sweeney J. Neural hyperexcitability in autism spectrum disorders. Brain Sci. 2017;7:129. - PMC - PubMed

Substances