. 2025 Mar 17;11(1):25.
doi: 10.1038/s41421-025-00789-x.

A decrease in Flavonifractor plautii and its product, phytosphingosine, predisposes individuals with phlegm-dampness constitution to metabolic disorders

Affiliations

A decrease in Flavonifractor plautii and its product, phytosphingosine, predisposes individuals with phlegm-dampness constitution to metabolic disorders

Lingru Li et al. Cell Discov. .

Abstract

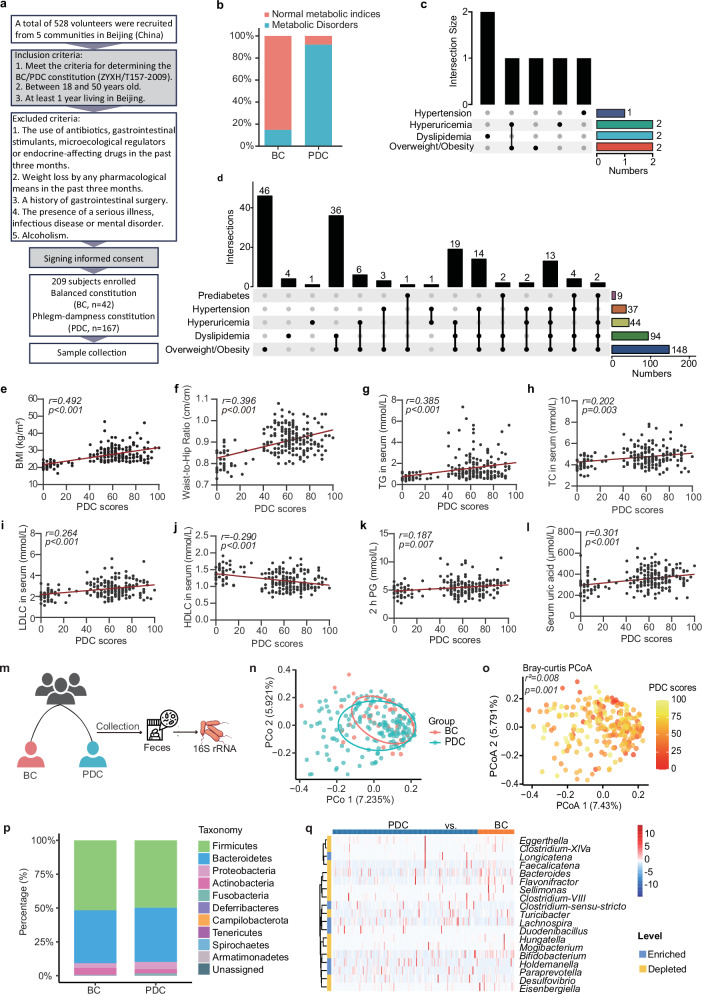
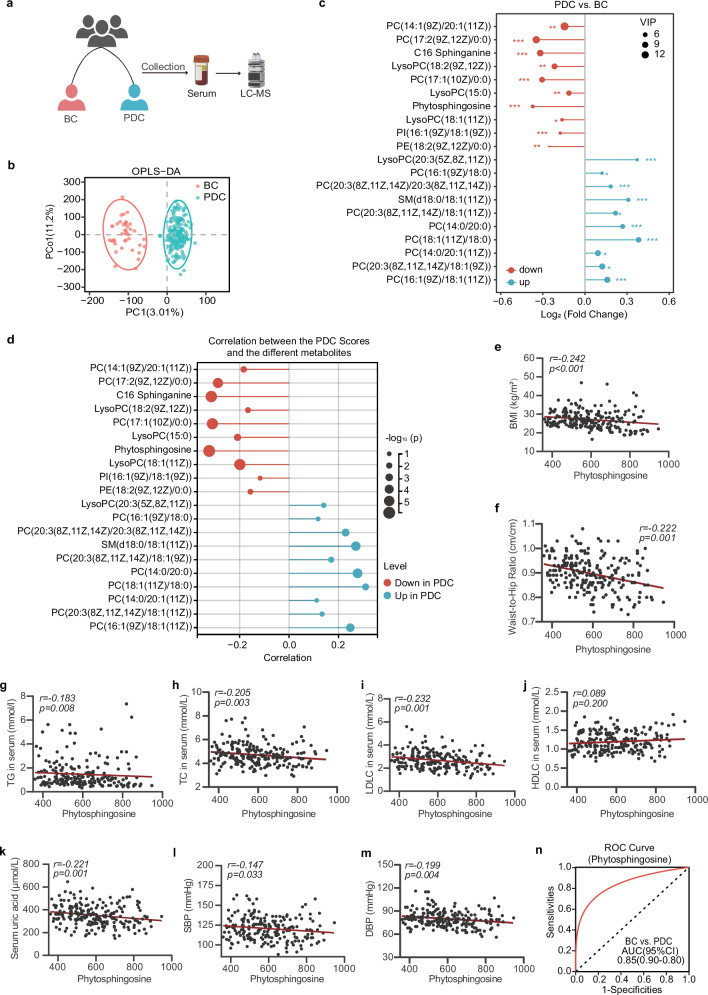
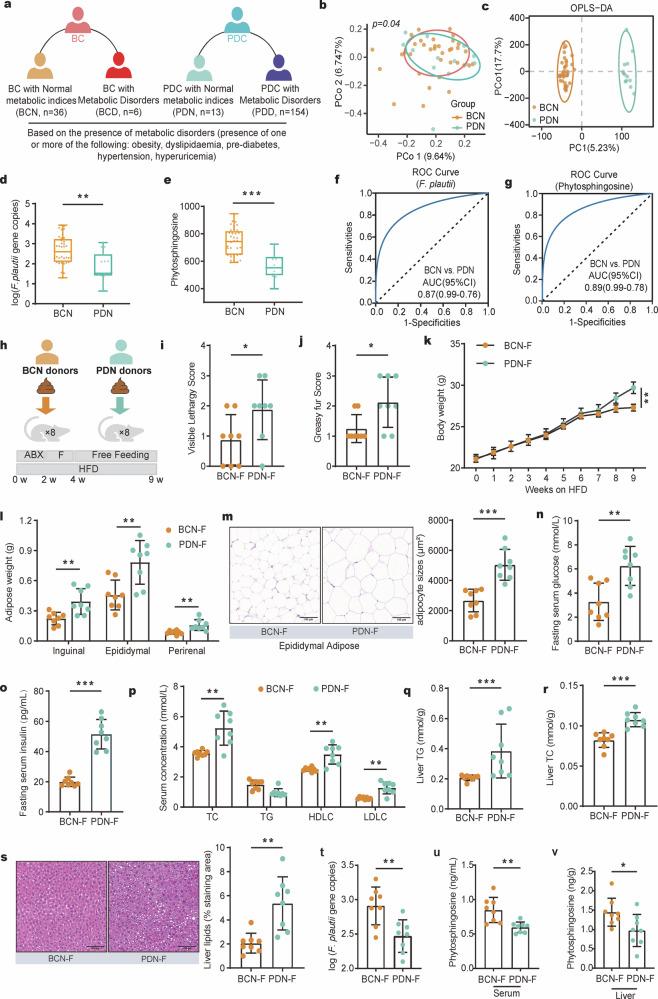
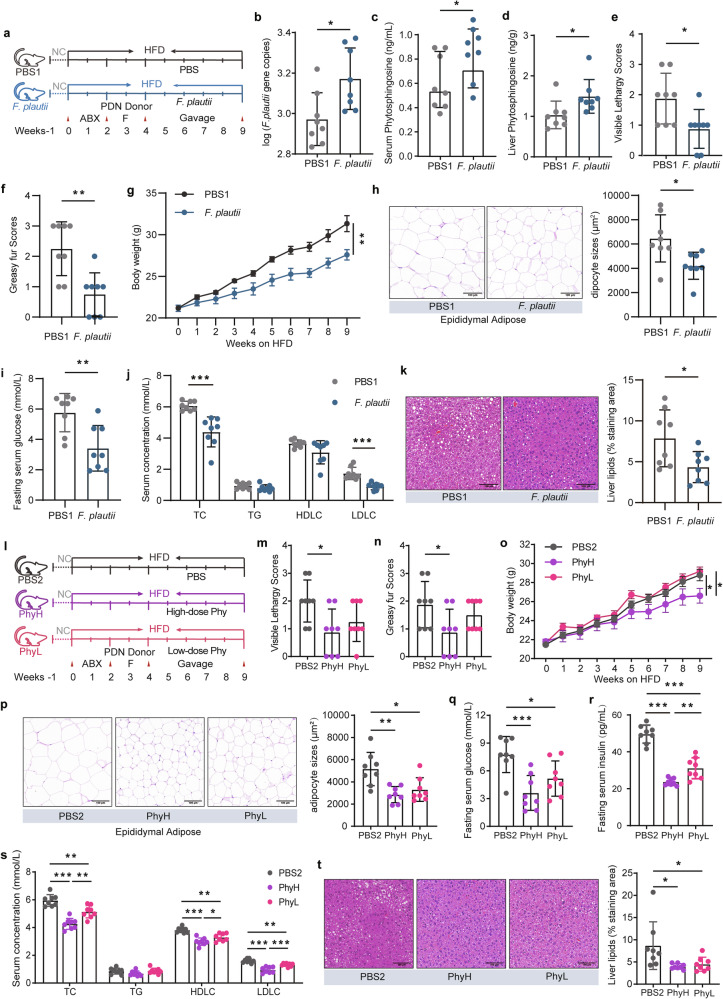
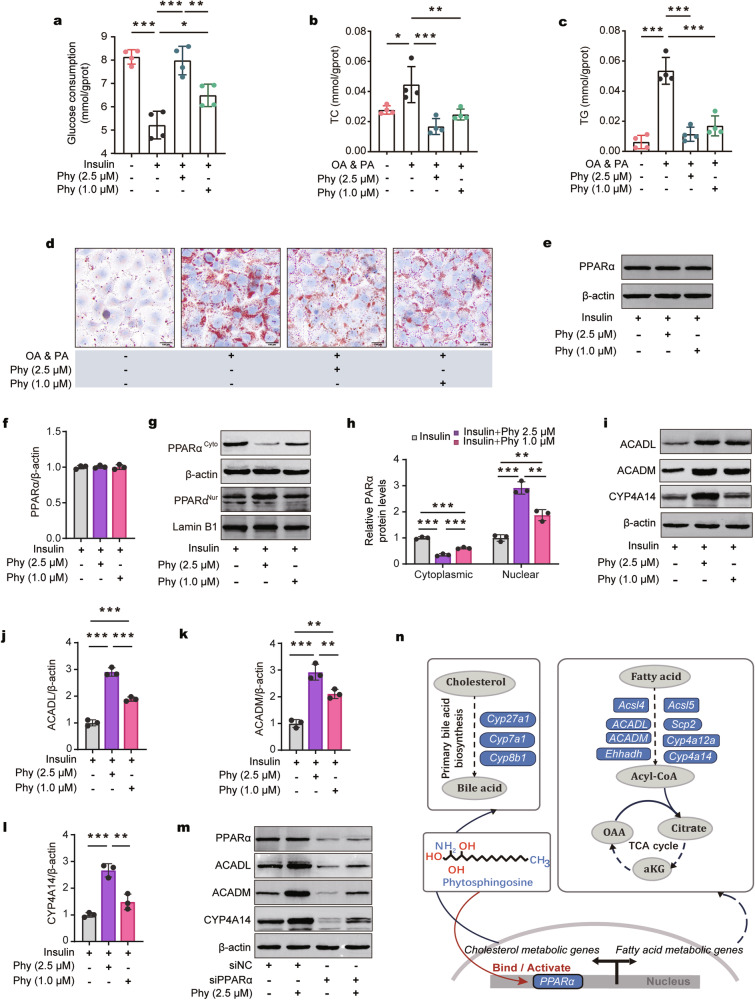
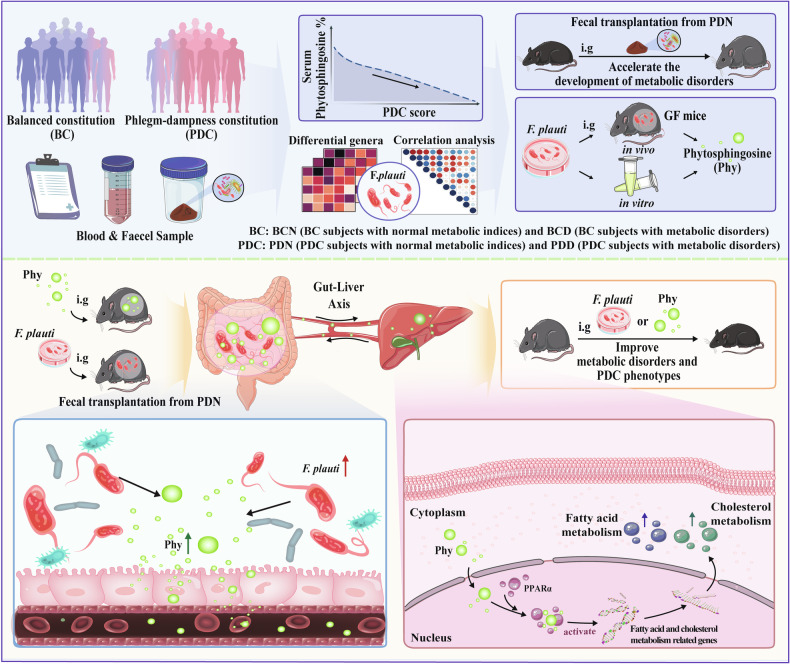
According to traditional Chinese medicine (TCM) constitutional theory, individuals with phlegm-dampness constitution (PDC) are at increased risk for metabolic disorders. Previous studies have indicated that PDC individuals exhibit gene expression changes associated with metabolic disorders, even individuals with normal metabolic indices. However, the biological mechanisms underlying these changes remain unclear. The gut microbiota has recently emerged as a promising avenue for elucidating TCM principles. Here, we revealed that individuals with PDC have distinct gut microbiota and serum metabolite profiles. A decrease in phytosphingosine was associated with increased PDC scores and metabolic disorder severity. Subsequent experiments demonstrated that Flavonifractor plautii can biosynthesize phytosphingosine, which was also negatively correlated with the PDC score. Interestingly, both F. plautii and phytosphingosine levels decreased in PDC subjects with normal metabolic indices. Fecal transplantation from these individuals accelerated the development of metabolic disorders in mice. However, supplementation with F. plautii and phytosphingosine ameliorated metabolic disorders by increasing phytosphingosine levels in the gut‒hepatic axis. Mechanistic investigations confirmed that phytosphingosine can directly bind to hepatic peroxisome proliferator-activated receptor α (PPARα) and activate its nuclear transcription activity, thereby regulating downstream gene expression related to glucose‒lipid metabolism. Our research indicates that the decrease in F. plautii and its product, phytosphingosine, contributes to gene expression changes related to metabolic disorders in PDC individuals and increases their susceptibility to metabolic disorders. These findings suggest that diagnosing PDC may be beneficial for identifying at-risk populations among apparently healthy individuals, thereby advancing the broader field of metabolic disorder prevention and TCM integration.


Conflict of interest statement

Conflict of interest: The authors declare no competing interests.

Figures

Fig. 1
Fig. 1. Diagnostic indices for PDC individuals.
The PDC scores were significantly correlated with metabolic indices, and PDC subjects had different gut microbial structures than BC subjects did.a Schematic representation of the clinical sample collection process. A total of 209 subjects, including 167 PDC subjects and 42 BC subjects, were enrolled. The inclusion criteria were as follows: 1. met the criteria for determining the BC/PDC constitution (ZYXH/T157-2009), 2. aged between 18 and 50 years, and 3. had at least 1 year of living in Beijing. The exclusion criteria were as follows: 1. the use of antibiotics, gastrointestinal stimulants, microecological regulators or endocrine-affecting drugs in the past three months; 2. weight loss by any pharmacological means in the past three months; 3. a history of gastrointestinal surgery; 4. the presence of a serious illness, infectious disease or mental disorder; or 5. alcoholism. In this cohort, we characterized the gut microbiome and serum metabolome and identified microbial and metabolic characteristics. b Total disease and health status of the PDC group and BC group. The blue color represents the subjects with normal metabolic indices; the orange color represents the subjects with metabolic disorders. c Details of the disease and health status of the subjects in the BC group. d Detailed disease and health status of the PDC group. el Spearman correlations (two-tailed Spearman’s rank test) between PDC scores and BMI (e), WHR (f), serum TG levels (g), serum TC levels (h), serum LDL-C levels (i), serum HDLC levels (j), 2 h PG (k), and serum uric acid levels (l). m Procedure for collecting human fecal samples. Fecal samples were collected, and the V3‒V4 region of the 16S rRNA gene was sequenced to identify microbial characteristics. n Principal coordinate analysis (PCoA) of the gut microbiota calculated from the Bray‒Curtis distance in the BC group and PDC group. p values were calculated with adonis via 6000 permutations. o The same PCoA plot (n), colored by PDC score. Gut microbial compositions of the BC group and PDC group at the phylum level (p) or the genus level (q). BC balanced constitution, PDC phlegm-dampness constitution, BMI body mass index, WHR waist‒to‒hip ratio, TG triglyceride, TC total cholesterol, LDLC low-density lipoprotein cholesterol, HDLC high-density lipoprotein cholesterol; 2 h PG, 2 h postprandial blood glucose.
Fig. 2
Fig. 2. PDC subjects had different serum metabolite structures than BC subjects did, and phytosphingosine was significantly correlated with PDC scores and metabolic indices.
a Procedure for collecting human serum samples. Serum samples were collected, and untargeted metabolomics was performed to identify metabolic characteristics. b OPLS–DA plot of the serum metabolites in the BC group and PDC group. The p values of the model are calculated via 1000 permutations. c The 10 most significantly altered metabolites of the PDC group with the highest VIP values among the up- and downregulated metabolites in comparison with those of the BC group. d Correlated bubble diagram of PDC scores with serum metabolic profiles. Red and blue indicate enrichment in BC and PDC individuals, respectively. Spearman correlations (two-tailed Spearman’s rank test) were performed. em Spearman correlations between serum phytosphingosine abundance and BMI (e), WHR (f), serum TG levels (g), serum TC levels (h), serum LDLC levels (i), serum HDLC levels (j), serum uric acid levels (k), SBP (l), and DBP (m). n ROC curve of the random forest model using phytosphingosine to distinguish PDC subjects from BC subjects. BC balanced constitution, PDC phlegm-dampness constitution, BMI body mass index, WHR waist‒to‒hip ratio, TG triglyceride, TC total cholesterol, LDLC low-density lipoprotein cholesterol, HDLC high-density lipoprotein cholesterol, SBP systolic blood pressure, DBP diastolic blood pressure.
Fig. 3
Fig. 3. F. plautii, which was significantly correlated with the phytosphingosine and PDC scores, can biosynthesize phytosphingosine in vitro and in germ-free mice.
a Correlated bubble diagram of phytosphingosine with various genera. b Correlated bubble diagram of PDC scores with differential genera. Red and blue indicate enrichment in BC and PDC individuals, respectively. Spearman correlations (two-tailed Spearman’s rank test) were performed. c Procedure for macrogenome sequencing and qPCR. Fecal samples were collected from all the subjects. Fecal samples from 40 PDC subjects and 10 age- and sex-matched BC subjects were subjected to metagenomic analysis to identify microbial characteristics. Fecal samples from all the subjects were subjected to qPCR to measure the levels of F. plautii. d, e Shannon indices (d) and PCoA plot (e) calculated from the Bray‒Curtis distance in 40 PDC subjects and 10 age- and sex-matched BC subjects. The differences were determined by the Wilcoxon rank-sum test. p values were calculated with adonis via 6000 permutations. f, g Relative abundance (f) and gene copies (g) of F. plautii in 40 PDC subjects and 10 age- and sex-matched BC subjects. The differences were determined by the Wilcoxon rank-sum test or t test. h, i Spearman correlations (two-tailed Spearman’s rank test) between the gene copies of F. plautii and serum phytosphingosine abundance (h) and PDC scores (i). j ROC curve of the RF model in which F. plautii was used to distinguish PDC subjects from BC subjects. k A schematic diagram of F. plautii in vitro culture. F. plautii was cultured in modified BHI broth. This experiment was repeated 3 times. l Growth curve of F. plautii in BHI broth. m Phytosphingosine levels at different growing points of F. plautii in BHI broth. Differences among groups were analyzed by one-way ANOVA with Tukey’s post hoc test. n Schematic representation of germ-free mice supplemented with F. plautii or not (n = 6). Eight-week-old GF mice were gavaged with phosphate-buffered saline containing F. plautii or lacking F. plautii and then maintained on a normal diet for 10 days. oq Fecal (o), serum (p), and liver (q) phytosphingosine levels of germ-free mice supplemented with F. plautii or not. BC, balanced constitution; PDC, phlegm-dampness constitution; PBS-G group: the germ-free mice were gavaged with PBS every day; F. plautii-G group: the germ-free mice were gavaged with 5 × 108 cfu F. plautii every day. The differences (oq) were determined via t-tests. The data in the bar plot are presented as the means ± SD. *, p < 0.05, **, p < 0.01, and ***, p < 0.001, respectively.
Fig. 4
Fig. 4. PDC subjects presented lower F. plautii and phytosphingosine levels, even those with normal metabolic indices, and fecal transplantation of these subjects accelerated the development of metabolic disorders in mice.
a Subgrouping schematic representation of the BC group and PDC group. A total of 209 fecal samples, including 167 PDC samples and 42 BC samples, were collected. According to the presence of metabolic disorders (one or more of the following: obesity, dyslipidemia, prediabetes, hypertension, or hyperuricemia), the BC subjects were divided into a BCN (BC subjects with normal metabolic indices) group and a BCD (BC subjects with metabolic disorders) group, and PDC subjects were divided into a PDN (PDC subjects with normal metabolic indices) group and a PDD (PDC subjects with metabolic disorders) group. b PCoA of the gut microbiota calculated from the Bray‒Curtis distance in the BCN group and PDN group. p values were calculated with adonis via 6000 permutations. c OPLS–DA plot of the serum metabolites in the BCN group and PDN group. The p values of the model are calculated via 1000 permutations. d, e Gene copies of F. plautii (d) and the levels of phytosphingosine (e) in the BCN and PDN groups. Differences among groups (d, e) were analyzed by one-way ANOVA with Tukey’s post hoc test. f ROC curve of the RF model using F. plautii to distinguish PDN subjects from BCN subjects. g ROC curve of the RF model using phytosphingosine to distinguish PDN subjects from BCN subjects. h Schematic representation of the fecal transplantation experiment. All the mice were treated with an antibiotic cocktail for two cycles. Following antibiotic treatment, the recipient mice received fecal slurry from the PDN group or BCN group daily for 14 consecutive days and were fed a HFD for 5 weeks. i, j Visible lethargy scores (i) and greasy fur scores (j) in the BCN-F group and PDN-F group. k Body weight (k) and adipose weight (l) during the fecal transplantation experimental period. m Representative images of adipocyte H&E staining and adipocyte sizes (%) in the BCN-F group and PDN-F group; images were taken at ×40 magnification. Scale bars, 100 μm. n = 8 for each group. n, o Fasting serum glucose (n) and serum uric acid (o) levels in the BCN-F group and PDN-F group. p Serum concentrations of TC, TG, LDLC, and HDLC in the BCN-F group and PDN-F group. q, r Liver TG (q) and liver TC (r) levels in the BCN-F group and PDN-F group. s Representative images of H&E-stained liver samples (scale bar, 100 μm). Liver lipids (%) in the BCN-F group and PDN-F group. t Gene copies of F. plautii in the BCN-F group and PDN-F group. u, v The levels of serum (u) and liver (v) phytosphingosine in the BCN-F group and PDN-F group. UA, uric acid; TG, triglyceride; TC, total cholesterol. In the BCN-F group, the antibiotic-treated mice received fecal slurry from the BCN group daily for 14 consecutive days and were fed a HFD for 5 weeks; in the PDN-F group, the antibiotic-treated mice received fecal slurry from the PDN group daily for 14 consecutive days and were fed a HFD for 5 weeks. The differences (iv) were determined via t-tests. The data in the bar plot are presented as the means ± SD. *, p < 0.05, **, p < 0.01, and ***, p < 0.001, respectively.
Fig. 5
Fig. 5. F. plautii and phytosphingosine ameliorate metabolic disorders induced by HFD and fecal transplantation in PDC subjects with normal metabolic indices.
a Schematic representation of the F. plautii supplementation experiment. PDN-F mice were treated with PBS (the PBS1 group) as a control, and PDN-F mice were treated with F. plautii as the F. plautii group for 5 weeks. b Gene copy numbers of F. plautii in the PBS1 group and F. plautii group. c, d The levels of serum (c) and liver (d) phytosphingosine in the PBS1 group and F. plautii group. e, f Visible lethargy scores (e) and greasy fur scores (f) in the PBS1 group and F. plautii group. g Body weight during the F. plautii supplementation experimental periods. h Representative images of adipocyte H&E staining and adipocyte sizes (%) in the PBS1 group and F. plautii group; images were taken at ×40 magnification. Scale bars: 100 μm. n = 8 for each group. i Serum glucose levels in the PBS1 group and F. plautii group. j Serum concentrations of TC, TG, LDLC, and HDLC in the PBS1 group and F. plautii group. k Representative images of H&E-stained liver samples (scale bar, 100 μm). Liver lipids (%) in the PBS1 group and F. plautii group. The differences (bk) were determined via a t-test. l Schematic representation of the phytosphingosine supplementation experiment. PDN-F mice were treated with PBS (PBS1 group) as a control, and PDN-F mice were treated with high or low doses of phytosphingosine (PhyH group or PhyL group, respectively) for 5 weeks. m, n Visible lethargy scores (m) and greasy fur scores (n) in the PBS2, PhyH, and PhyL groups. o Body weight during the phytosphingosine supplementation experimental periods. p Representative images of adipocyte H&E staining and adipocyte sizes (%) in the PBS2, PhyH, and PhyL groups; images were taken at ×40 magnification. Scale bars: 100 μm. n = 8 for each group. q Serum glucose levels in the PBS2, PhyH, and PhyL groups. r Fasting serum insulin in the PBS2, PhyH, and PhyL groups. s Serum concentrations of TC, TG, LDLC, and HDLC in the PBS2, PhyH, and PhyL groups. t Representative images of H&E-stained liver samples (scale bar, 100 μm) and liver lipids (%) in the PBS2, PhyH, and PhyL groups. Differences among groups (mt) were analyzed by one-way ANOVA with Tukey’s post hoc test. PDN-F mice received fecal slurry from the PDN group daily for 14 consecutive days and were fed a HFD for 5 weeks. In the PBS1 group, the PDN-F mice were gavaged with PBS every day in animal experiment 2. In the F. plautii group, PDN-F mice were gavaged with 5 × 108 cfu F. plautii every day in the animal experiment. 2. In the PBS2 group, the PDN-F mice were gavaged with PBS every day in animal experiment 3. In the PhyH group, PDN-F mice were gavaged with 50 mg/kg phytosphingosine every day in animal experiment 3. In the PhyL group, PDN-F mice were gavaged with 25 mg/kg phytosphingosine every day in animal experiment 3. *, p < 0.05, **, p < 0.01, and ***, p < 0.001, respectively. The data in the bar plot are presented as the means ± SD.
Fig. 6
Fig. 6. Phytosphingosine activates PPARα to ameliorate metabolic disorders in vivo.
a Schematic representation of the liver transcriptome analysis. Enrichment analyses of 190 differentially expressed common genes after F. plautii intervention or phytosphingosine intervention were performed. b Enriched KEGG pathways of the differentially expressed genes. c Biological process of a GO functional analysis. d Heatmap of hepatic PPARα and downstream gene relative mRNA expression in the PBS2, PhyH, and PhyL groups. The relative gene expression in the PBS group was normalized to 1. Eight biological replicates were performed for each group. e Immunoblot analysis of hepatic PPARα and downstream proteins in the PBS2, PhyH, and PhyL groups (biological replicates for each group). f Immunoblot analysis and densitometry analysis of nuclear PPARα and cytoplasmic PPARα in the PBS2, PhyH, and PhyL groups (3 biological replicates for each group). g Immunofluorescence analysis and densitometry analysis of DAPI and PPARα and a merged image of DAPI and PPARα in the PBS2, PhyH, and PhyL groups; relative luminance curves of DAPI and PPARα in a representative area (from the cytoplasm to the cytoplasm). h SPR binding analysis of phytosphingosine to PPARα. PDN-F mice received fecal slurry from the PDN group daily for 14 consecutive days and were fed a HFD for 5 weeks. In the PBS1 group, the PDN-F mice were gavaged with PBS every day in animal experiment 2. In the F. plautii group, PDN-F mice were gavaged with 5 × 108 cfu F. plautii every day in animal experiment 2. In the PBS2 group, PDN-F mice were gavaged with PNSs every day in animal experiment 3. In the PhyH group, PDN-F mice were gavaged with 50 mg/kg phytosphingosine every day in animal experiment 3. In the PhyL group, PDN-F mice were gavaged with 25 mg/kg phytosphingosine every day in animal experiment 3. IOD, integral optical density; KD, equilibrium association constant; DAPI, 4′,6-diamidino-2-phenylindole. Differences among groups were analyzed by one-way ANOVA with Tukey’s post hoc test. *, p < 0.05, **, p < 0.01, and ***, p < 0.001, respectively. The data in the bar plot are presented as the means ± SD.
Fig. 7
Fig. 7. Phytosphingosine activates PPARα to ameliorate metabolic disorders in vitro.
a Glucose consumption in insulin-induced HepG2 cells treated with phytosphingosine. b, c Cellular TC (b) and cellular TG (c) contents in oleic acid-induced HepG2 cells treated with phytosphingosine. n = 4 (ac). d Representative images of Oil Red O staining (scale bar, 100 μm) in OA- and PA-induced HepG2 cells treated with phytosphingosine. e, f Immunoblot (e) and densitometric (f) analyses of PPARα in insulin-induced HepG2 cells treated with phytosphingosine. g, h Immunoblot (g) and densitometric (h) analyses of nuclear PPARα and cytoplasmic PPARα in insulin-induced HepG2 cells treated with phytosphingosine. il Immunoblot analysis and densitometry analysis of ACADL, ACADM, and CYP4A14 in insulin-induced HepG2 cells treated with phytosphingosine. m Immunoblot analysis of PPARα, ACADL, ACADM, and CYP4A14 after PPARα was knocked down in insulin-induced HepG2 cells treated with phytosphingosine. n = 3 (em). n Schematic representation of the possible mechanism by which phytosphingosine targets PPARα. PA palmitic acid, OA oleic acid, Phy phytosphingosine. Differences among groups were analyzed by one-way ANOVA with Tukey’s post hoc test. *, p < 0.05, **, p < 0.01, and ***, p < 0.001, respectively. The data in the bar plot are presented as the means ± SD.
Fig. 8
Fig. 8. The decrease in F. plautii and its product, phytosphingosine, predisposes individuals with phlegm-dampness constitution to metabolic disorders.
(1) Compared with BC subjects, PDC subjects have distinct gut microbiota and serum metabolite profiles. (2) Decreases in F. plautii and phytosphingosine were associated with higher PDC scores. (3) The bacteria F. plautii biosynthesizes phytosphingosine. (4) F. plautii and serum phytosphingosine levels decreased in PDC subjects with normal metabolic indices. (5) Fecal transplantation from PDC subjects with normal metabolic indices accelerated the development of metabolic disorders in mice. (6) F. plautii or phytosphingosine significantly improved metabolic disorders and PDC phenotypes. (7) Phytosphingosine produced by F. plautii binds to PPARα and activates the nuclear transcription of PPARα.

References

    1. Saklayen, M. G. The global epidemic of the metabolic syndrome. Curr. Hypertens. Rep.20, 12 (2018). - PMC - PubMed
    1. Lovic, D. et al. The growing rpidemic of diabetes mellitus. Curr. Vasc. Pharmacol.18, 104–109 (2020). - PubMed
    1. Phelps, N. H. et al. Worldwide trends in underweight and obesity from 1990 to 2022: a pooled analysis of 3663 population-representative studies with 222 million children, adolescents, and adults. Lancet403, 1027–1050 (2024). - PMC - PubMed
    1. Martin, S. S. et al. Lipid distributions in the global diagnostics network across five continents. Eur. Heart J.44, 2305–2318 (2023). - PMC - PubMed
    1. Zhang, S. et al. Hyperuricemia and cardiovascular disease. Curr. Pharm. Des.25, 700–709 (2019). - PubMed

LinkOut - more resources