. 2025 Mar 17;10(1):24.
doi: 10.1038/s41525-025-00482-8.

NGS-based Aspergillus detection in plasma and lung lavage of children with invasive pulmonary aspergillosis

Affiliations

NGS-based Aspergillus detection in plasma and lung lavage of children with invasive pulmonary aspergillosis

Emmy Wesdorp et al. NPJ Genom Med. .

Abstract

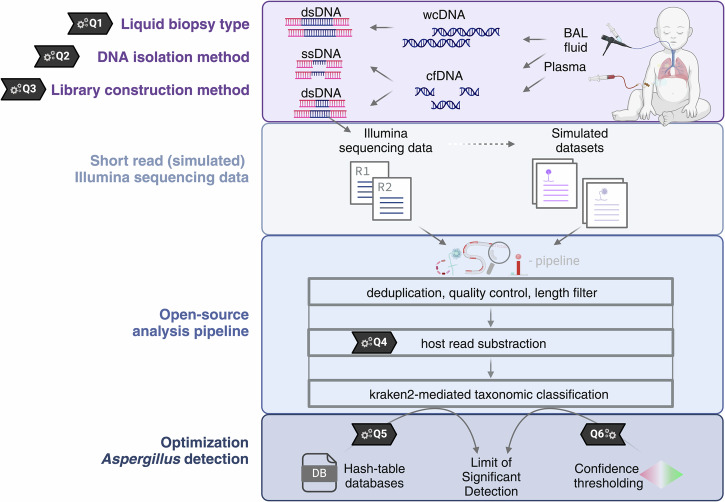
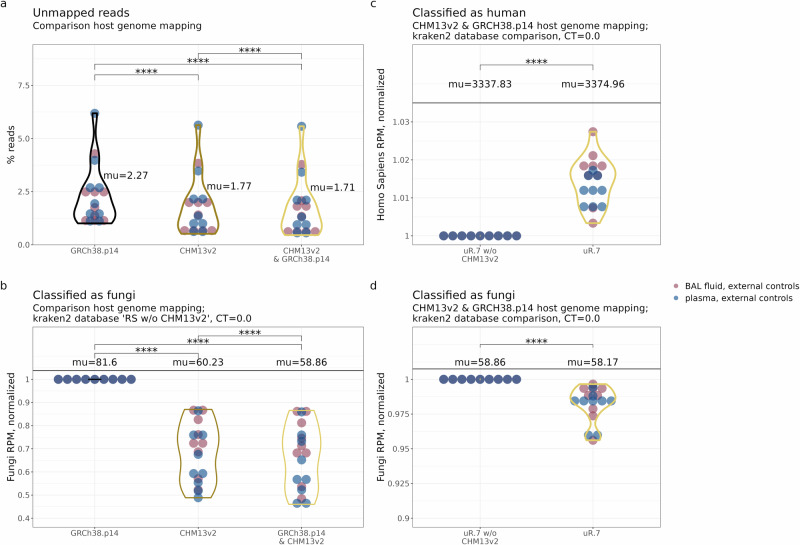
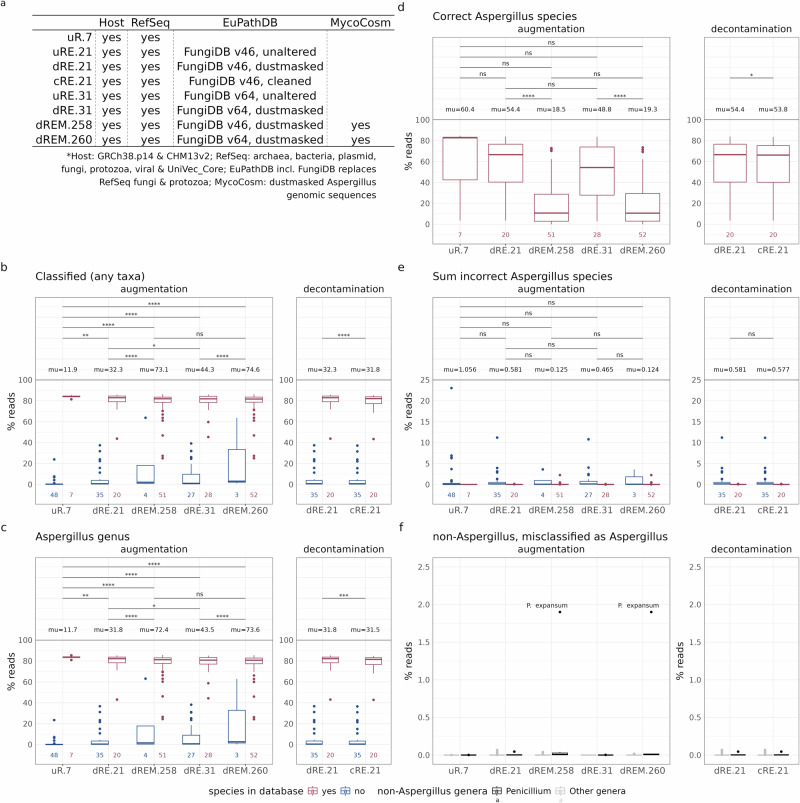
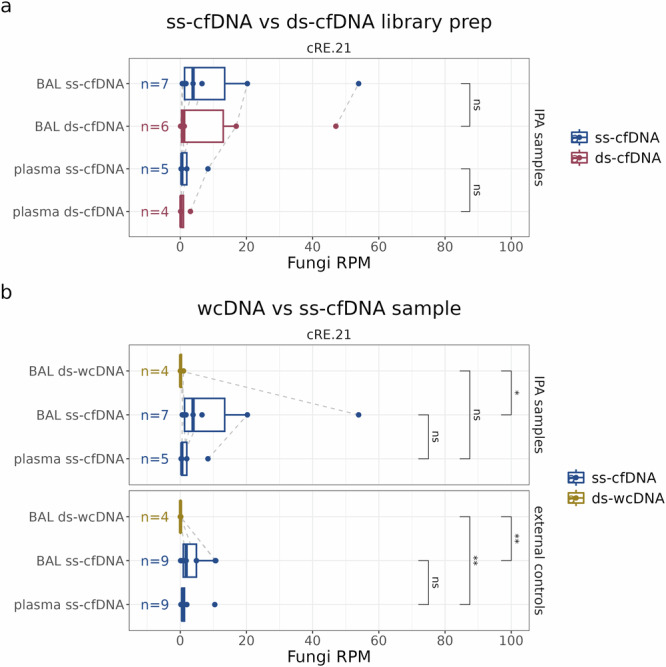
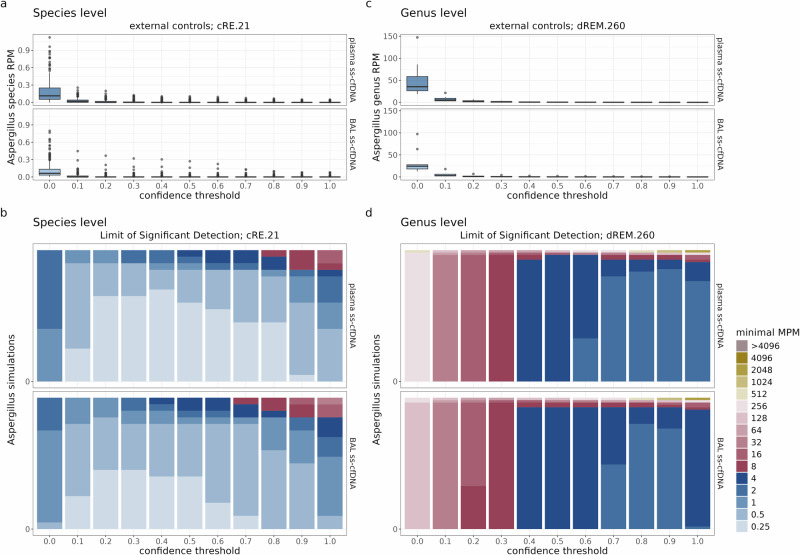
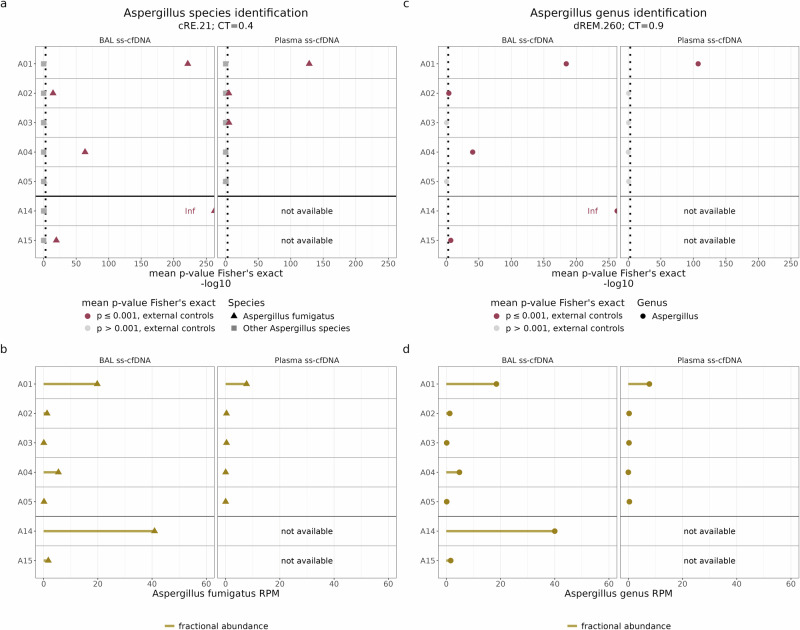
In immunocompromised pediatric patients, diagnosing invasive pulmonary aspergillosis (IPA) poses a significant challenge. Next-Generation Sequencing (NGS) shows promise for detecting fungal DNA but lacks standardization. This study aims to advance towards clinical evaluation of liquid biopsy NGS for Aspergillus detection, through an evaluation of wet-lab procedures and computational analysis. Our findings support using both CHM13v2.0 and GRCh38.p14 in host-read mapping to reduce fungal false-positives. We demonstrate the sensitivity of our custom kraken2 database, cRE.21, in detecting Aspergillus species. Additionally, cell-free DNA sequencing shows superior performance to whole-cell DNA sequencing by recovering higher fractions of fungal DNA in lung fluid (bronchoalveolar lavage [BAL] fluid) and plasma samples from pediatric patients with probable IPA. In a proof-of-principle, A. fumigatus was identified in 5 out of 7 BAL fluid samples and 3 out of 5 plasma samples. This optimized workflow can advance fungal-NGS research and represents a step towards enhancing diagnostic certainty by enabling more sensitive and accurate species-level diagnosis of IPA in immunocompromised patients.


Conflict of interest statement

Competing interests: F.H. has received products/financial compensation from Pathonostics, OLM Diagnostics, Altona Diagnostics, EWC Diagnostics, CHROMagar, and IMMY in the context of product validation (and has published or will publish about the outcome of these studies). C.L. has received financial support from Pfizer for educational purposes. L.B. has regular interaction with pharmaceutical and other industrial partners. L.B. has not received personal fees or other personal benefits, but UMCU has received significant funding (>€100,000 per industrial partner) for investigator-initiated studies from AstraZeneca, Sanofi, Janssen, Pfizer, MSD, and MeMed Diagnostics, as well as major funding from the Bill and Melinda Gates Foundation and through public-private partnerships such as the IMI-funded RESCEU and PROMISE projects, involving partners GSK, Novavax, Janssen, AstraZeneca, Pfizer, and Sanofi, along with substantial funding from Julius Clinical for participation in clinical studies sponsored by AstraZeneca, Merck, and Pfizer, and minor funding (€1,000-25,000 per industrial partner) for consultation, DSMB membership, or invited lectures by Ablynx, Bavaria Nordic, GSK, Novavax, Pfizer, Moderna, AstraZeneca, MSD, Sanofi, and Janssen. L.B. is the founding chairman of the ReSViNET Foundation. J.d.R. is cofounder and CTO of Cyclomics, a genomics company. L.R., L.C., M.J., N.B., C.V., T.v.d.B. and T.W. declare no competing interests.

Figures

Fig. 1
Fig. 1. NGS library strategies and the cfSPI open-source workflow for Aspergillus detection.
Our comparative study employs Illumina shotgun sequencing to enhance Aspergillus DNA detection in liquid biopsies from pediatric immunocompromised patients. We set to optimize six key steps (Q#1-6) for microbial NGS-based Aspergillus diagnostics in IMD patients. We compared two cell-free DNA NGS library preparation strategies — single-stranded (ss) and double-stranded (ds) ligation — across plasma and bronchoalveolar lavage (BAL) fluid samples (Q#1), alongside a comparison of BAL cfDNA to whole-cell DNA (wcDNA) NGS (Q#2-3). After sequencing, we employ the open-source cell-free DNA pathogen identification workflow known as the cell-free DNA Single-strand Pathogen Identification pipeline (cfSPI), which is tailored for detecting Aspergillus species. Within the cfSPI pipeline, we conduct quality control of sequencing data followed by host-read subtraction (Q#4) and taxonomic classification using kraken2 with various hash-table genome reference databases (Q#5) and confidence thresholds (Q#6). To assess the accuracy of (Aspergillus) read classification, we further simulate short-read Illumina sequencing data. In our Limit of Significant Detection analysis, we investigate how hash-table database complexity and confidence thresholds impact the theoretical minimum number of molecules per million needed to detect significantly elevated Aspergillus taxon above the background levels in control patient samples. All six key steps underwent optimization through comparative experimental testing. Illustrations was created using BioRender (https://BioRender.com/o72k148).
Fig. 2
Fig. 2. Determining the impact of CHM13v2 host genome mapping for optimizing microbial read quantification in control samples.
a Percentage of reads remaining after mapping to the human reference genome (i.e., % unmapped reads) using the cfSPI workflow. Reads were mapped either to human reference genome GRCh38.p14, CHM13v2, or a combination of these two. b Fractional abundance of fungi (kingdom) kraken2 classified reads (CT = 0, kraken2’s default), after subtracting host reads via reference genome mapping, normalized to the old version of the human genome assembly (GRCh38.p14). Fractional abundance of c. human (species) and d fungi (kingdom) classified reads when utilizing the ‘CHM13v2-containing uR.7’ or ‘uR.7’ database for kraken2 taxonomic classification (CT = 0, kraken2’s default) after dual-mapping to the host genome, normalized to ‘uR.7’. In ad, each data point represents one control sample (9 BAL; 9 plasma), with colors indicating the sample type. Mean values are denoted as ‘mu’. Statistical analysis included one-tailed paired t-tests with Bonferroni correction (****, p ≤ 0.0001).
Fig. 3
Fig. 3. Database-dependent taxon detection in simulated Aspergillus samples.
a Kraken2 hash-table database composition overview (for comprehensive details on database composition, see Supplementary Fig. 2 and for details on database construction see Methods and Supplementary Data 5). Boxplots displaying the results of the classification of simulated Aspergillus samples, including b. the overall classification rate (e.g., percentage reads classified to any taxon) as well the percentage of reads classified at the c. Aspergillus genus level, d. to correct Aspergillus species, and e. cumulative percentage to incorrect Aspergillus species. Read classification percentages are shown across databases (x-axis). f. Displaying the results of the classification of Penicillium (n = 7) and other fungal genera (n = 25). The boxplots show the percentage of non-Aspergillus simulated reads that were erroneously classified as Aspergillus. b-f. The CT was set at 0.8 for kraken2-based classification, to increase precision. In b-e. the effects of hash-table database augmentation (on the left) and decontamination (on the right) on accuracy are tested via a one-tailed t-test with Bonferroni correction (*, p ≤ 0.05; **, p ≤ 0.01; ***, p ≤ 0.001; ****, p ≤ 0.0001; ns, p > 0.05) and the mean percentages are denoted as ‘mu’. The boxplot bounds in b-f. represent the 25th and 75th percentiles, with the center line indicating the median. Whiskers extend to 1.5 times the interquartile range.
Fig. 4
Fig. 4. ss-ligation of cfDNA most effective in retrieving fungal DNA.
a, b Boxplots showing the fungal (kingdom) fractional abundance in RPM, determined by cRE.21-mediated taxonomic classification (CT = 0.8). This analysis was conducted, where possible, for both IPA patients and external control samples. a Comparison fungal fractional abundance in sequencing libraries, emphasizing the impact of ss- versus ds-ligation based library preparation. b Comparison of BAL pellet wcDNA to supernatant cfDNA sequencing. a, b The boxplot bounds represent the 25th and 75th percentiles, with the center line indicating the median. Whiskers extend to 1.5 times the interquartile range. Statistical significance is evaluated through a one-tailed Wilcoxon rank test with Bonferroni correction (*, p ≤ 0.05; **, p ≤ 0.01; ns, p > 0.05). Dotted lines connect sequenced libraries derived from samples collected from the same patient.
Fig. 5
Fig. 5. Computational analysis theoretical minimum fraction required for Aspergillus detection to optimize database and parameter selection.
The fractional a. species level (cRE.21-mediated classification) and c. genus level (dREM.260-mediated classification) abundance of Aspergillus (in RPM) delineated for plasma (n = 9) and for BAL fluid (n = 11) external control samples. In a,c. the boxplot bounds represent the 25th and 75th percentiles, with the center line indicating the median. Whiskers extend to 1.5 times the interquartile range. Leveraging the background levels from our external control samples and classification rates derived from simulations (not shown), we calculated the theoretical minimum fraction of Aspergillus molecules (in molecules per million; MPM) necessary for the detection of significantly elevated Aspergillus levels above the control background, as visualized in b,d. The minimum of Aspergillus MPM was computed both at the b. species level (cRE.21-mediated) and d. genus level (dREM.260-mediated), at a theoretical sequencing depth of 70 million (M) reads/sample (for details, see Methods). The subsequent confidence threshold (CT) parameter optimization was based on the highest fraction of observation at <4 MPM.
Fig. 6
Fig. 6. Elevated Aspergillus levels in a subset of IPA patient samples processed via ss-cfDNA NGS.
To compare the fractional abundance of Aspergillus taxon in patient samples with invasive pulmonary aspergillosis (IPA) to external control pediatric cancer patient samples, the one-tailed Fisher’s exact test was utilized. a,c. This analysis was performed both a. at the species level, using the cRE.21 database (CT = 0.4), and c. at the genus level, using the dREM.260 (CT = 0.9) (see Methods for details). Dot plots display the mean -log10-transformed computed p-values, with the significance threshold set at p = 0.001 indicated by a vertical dotted line. Instances exceeding the significance threshold are highlighted in dark red. Lollipop plot displaying the fractional abundance of b. A. fumigatus, determined using the cRE.21 (CT = 0.4) and d. the fractional abundance of Aspergillus at the genus level, determined using the dREM.260 (CT = 0.9), in BAL and plasma IPA samples. Abbreviations: Inf, infinite value; not available, sample not available.

Similar articles

References

    1. Loeffen, E. A. H. et al. Treatment-related mortality in children with cancer: prevalence and risk factors. Eur. J. Cancer121, 113–122 (2019). - PubMed
    1. Pana, Z. D., Roilides, E., Warris, A., Groll, A. H. & Zaoutis, T. Epidemiology of invasive fungal disease in children. J. Pediatric Infect. Dis. Soc.6, S3–S11 (2017). - PMC - PubMed
    1. Lehrnbecher, T. et al. Incidence and outcome of invasive fungal diseases in children with hematological malignancies and/or allogeneic hematopoietic stem cell transplantation: Results of a prospective multicenter study. Front. Microbiol.10, 681 (2019). - PMC - PubMed
    1. Cesaro, S. et al. Retrospective study on the incidence and outcome of proven and probable invasive fungal infections in high-risk pediatric onco-hematological patients. Eur. J. Haematol.99, 240–248 (2017). - PubMed
    1. Bartlett, A. W. et al. Epidemiology of invasive fungal infections in immunocompromised children; an Australian national 10-year review. Pediatr. Blood Cancer66, e27564 (2019). - PubMed

LinkOut - more resources