Monitoring, modeling, and forecasting long-term changes in coastal seawater quality due to climate change
- PMID: 40097418
- PMCID: PMC11914151
- DOI: 10.1038/s41467-025-57913-4
Monitoring, modeling, and forecasting long-term changes in coastal seawater quality due to climate change
Abstract
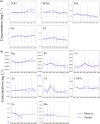
As climate change affects the physicochemical properties of coastal water, the resulting element re-exposure may override the emission reductions achieved by human pollution control efforts. Here, we conduct an analysis the water quality-climate effect over eight consecutive years from 2015 to 2022 along the South China coast combined with CMIP6 Scenario Model Intercomparison Project. Then we utilized a data-driven model to predict the concentrations of trace metals and nutrients over the next 80 years. It is suggested that the acidification process carries the risk of triggering the ocean's buffering mechanisms. During this alkalinity replenishment process, trace metals, such as Cd, Cr, Cu, Fe, Hg, Mn, Pb, and Zn, in the sediment are released into the water phase, along with Ca2+ and Mg2+. Here, the aim of this study is to show that the nexus of re-exposure-eutrophication-emission reduction with human activities and climate feedback, cannot be ignored in the pursuit of effective environmental governance.
© 2025. The Author(s).
Conflict of interest statement
Competing interests: The authors declare no competing interests.
Figures


References
-
- Walsh, J. J. Importance of continental margins in the marine biogeochemical cycling of carbon and nitrogen. Nature350, 53–55 (1991).
-
- Mackenzie, F. T., Lerman, A. & Ver, L. M. B. Role of the continental margin in the global carbon balance during the past three centuries. Geology26, 423–426 (1998).
-
- Bauer, J. E. et al. The changing carbon cycle of the coastal ocean. Nature504, 61–70 (2013). - PubMed
-
- Gruber, N. Carbon at the coastal interface. Nature517, 148–149 (2015). - PubMed
Grants and funding
LinkOut - more resources
Full Text Sources
Research Materials
Miscellaneous

