

doi: 10.1038/s41467-025-57839-x.
A supramolecular bactericidal material for preventing and treating plant-associated biofilms
Affiliations
- PMID: 40097425
- PMCID: PMC11914267
- DOI: 10.1038/s41467-025-57839-x
Item in Clipboard
A supramolecular bactericidal material for preventing and treating plant-associated biofilms
Nat Commun.
.
Abstract
Treating bacterial biofilms on plants poses challenges due to biofilm induced resistance and poor agent adhesion on plant leaves. Here, we report on a host-guest self-assembled material which is biocompatible, has a lamellar supramolecular structure for leaf retention and prevents and treats bacterial biofilms. Phosphate/isopropanolamine-modified ferrocene forms a host-guest complex with β-CD which assembles into a lamella structure. The agent shows control efficacy against bacterial blight, bacterial leaf streak, and citrus canker in testing.
© 2025. The Author(s).
Conflict of interest statement
Competing interests: The authors declare no competing interests.
Figures

Schematic depiction of the preparation of potent functional supramolecular bactericidal materials with superior bioavailability for the management of plant biofilm infections.

General synthetic procedure for target molecules FcP1-FcP20.
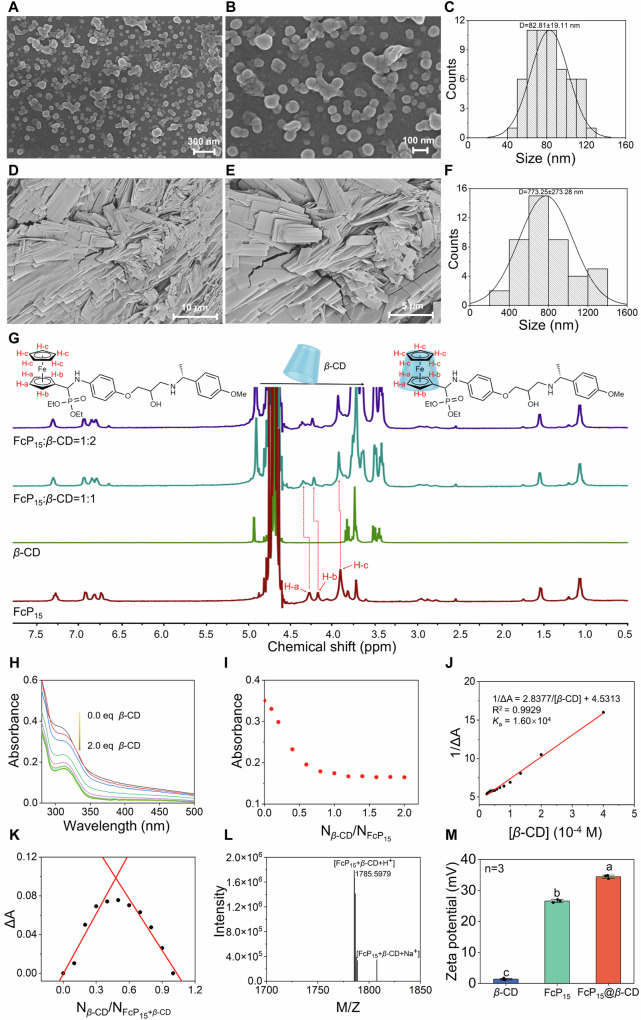
A, B SEM images of FcP15. C Size distributions of FcP15. D, E SEM images of FcP15@β-CD. F Size distributions of FcP15@β-CD. G
1H NMR spectra of FcP15, β-CD, and mixtures of FcP15 and β-CD at molar proportions of 1:1 and 1:2 in D2O, with a FcP15 concentration of 5.0 mM. H UV–vis titration curves for FcP15 (0.1 mM) in the presence of increasing molar equivalents of β-CD (0–2.0 eq). I Linearity of absorption spectra at 315 nm of FcP15 with respect to β-CD at various concentrations. J Benesi–Hildebrand plots of 1/ΔA versus 1/β-CD. K Job’s method of continuous plot of ΔA at 315 nm, with FcP15 and β-CD concentrations both set to 0.1 mM in H2O. L High-resolution mass spectrum of FcP15@β-CD. M Measurement of Zeta potential of FcP15@β-CD, FcP15, and β-CD in aqueous solution. In (M), the error bars show the mean ± standard error (SE). Statistically significant differences were assessed using one-way ANOVA followed by the least significant difference (LSD) post-hoc test, with different letters indicating significant variations (n = 3, p < 0.05). The experiments were performed with at least three replicates. Source data are provided as a Source Data file.

A Images of aqueous solutions of FcP15, FcP15@β-CD, and β-CD. B Surface tension and C contact angle measurements for aqueous solutions of water, β-CD, FcP15, and FcP15@β-CD at 200 μg/mL. D Images depicting droplet rebound behavior on the rice surface, droplet dropped from 10 cm. E Images showing droplet splash behavior on the rice surface, droplet dropped from 35 cm. F Time-dependent changes in the normalized droplet touch diameter (Ht/D0) for aqueous solutions including water, β-CD, FcP15, and FcP15@β-CD droplets during the droplet bounce test. G Time-dependent variations in the normalized touch diameter (Dt/D0) for aqueous solutions including water, β-CD, FcP15, and FcP15@β-CD droplets during the droplet splash test. H Liquid holding capacities of rice leaves after immersion in different solutions. I Scanning electron microscopy images comparing untreated rice leaf, rice leaf treated with FcP15, and rice leaf treated with FcP15@β-CD. In (B, H), error bars show the mean ± standard error (SE). Different letters indicate statistically significant differences, as determined by one-way ANOVA and subsequent least significant difference (LSD) post-hoc test (p < 0.05). The experiments were carried out with a minimum of three replicates, and the sample size for each data point is provided in the respective figure. Source data are provided as a Source Data file.

A Crystal violet staining analysis showing the effect of FcP15 and FcP15@β-CD on Xoo biofilm formation (ranging from 0.5 × EC50 to 8.0 × EC50) over 48 h. B The absorbance at 570 nm and 595 nm was measured to evaluate the remaining biofilm and the level of bacterial proliferation. C The biofilm inhibition rates were derived from the OD570 nm values after treatment with FcP15 and FcP15@β-CD. D
Xoo forms biofilm colonies after treatment with different concentrations of FcP15 and FcP15@β-CD on NA solid medium. E Enumeration of Xoo colonies from the agar plates after treatment. For (B, C, E), error bars represent means ± standard error (SE), and statistically significant differences between the means were determined using Student’s t test, with significance levels indicated as *p < 0.05, **p < 0.01, and ***p < 0.001; n.s. denotes no significance. The experiments were conducted with a minimum of three replicates, and the sample size for each data point is specified within the respective figure. Source data are provided as a Source Data file.
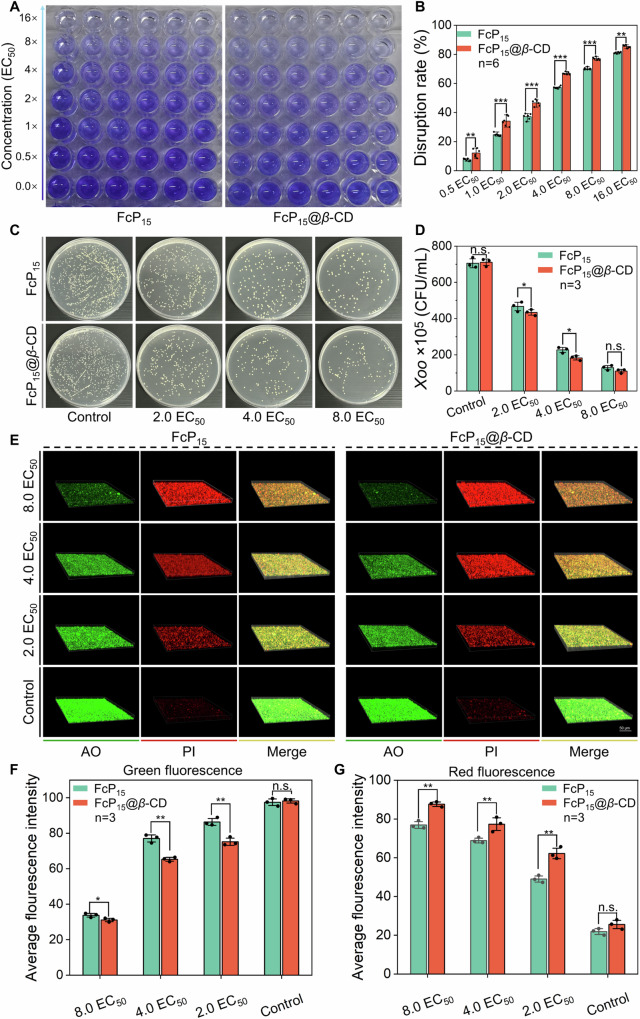
A Images illustrating pre-established biofilms assessed using crystal violet staining. B Quantification of pre-established Xoo biofilm destruction following exposure to varying doses of FcP15 and FcP15@β-CD. C Development of Xoo colonies within established biofilms on solid NA medium after exposure to various concentrations of FcP15 and FcP15@β-CD. D Performing a quantitative assessment of Xoo colonies on the agar plates. E 3D CLSM images depicting Xoo communities in established biofilms following exposure to varying concentrations of FcP15 and FcP15@β-CD. The biofilm cells were stained sequentially with AO (green: live cells) and PI (red: dead cells), with a scale bar of 50 μm. F, G Enumeration of live (Green fluorescence area) and deceased (red fluorescence area) Xoo communities from the aforementioned CLSM 3D images using Image-J. In (B, D, F, G), error bars represent the mean ± standard error (SE). Statistical analysis of the differences between means was carried out using Student’s t-test, with significance levels indicated as *p < 0.05, **p < 0.01, and ***p < 0.001; n.s. denotes no significant difference. Each experiment was performed with at least three independent replicates, and the sample size for each data point is clearly indicated in the respective figure. Source data are provided as a Source Data file.

A Induction of EPS yield by FcP15 and FcP15@β-CD at different concentrations (from 0.5 to 4.0×EC50). B Expression levels of gum genes related to EPS synthesis in Xoo upon treatment with 2.0×EC50 of FcP15 and FcP15@β-CD. Swimming motility assays (C) and the corresponding diameter of swimming circles (D) of Xoo following treatment with β-CD, FcP15, and FcP15@β-CD. E Gene expression related to the swimming motility of Xoo after exposure to 2.0×EC50 of FcP15 and FcP15@β-CD. F Images illustrating extracellular cellulase and extracellular amylase activity, along with circle diameters of extracellular cellulase (G) and amylase (H) post-intervention with FcP15@β-CD, FcP15, and β-CD. I The culture supernatants were used to extract DSF, which was then analyzed by TLC and visualized under UV light at 254 nm and in an iodine chamber. J Expression of rpf genes involved in DSF production in Xoo upon treatment with 2.0×EC50 of FcP15 and FcP15@β-CD. K Representative images of rice leaves infected by Xoo through the leaf-clipping inoculation method, treated with β-CD, FcP15, and FcP15@β-CD at 8.90 μg/mL. L Quantification of leaf lesion lengths from the aforementioned pathogenicity assay. For panels (A, B, D, E, G, H, J, L), error bars represent means ± standard error (SE). For (A), statistically significant differences between the means were determined using Student’s t-test, with significance levels indicated as *p < 0.05, **p < 0.01, and ***p < 0.001; n.s. denotes no significance. For (B, D, E, G, H, J, L), different letters denote statistically significant differences, determined by one-way ANOVA followed by the least significant difference (LSD) post-hoc test analysis (p < 0.05). The experiments were conducted with a minimum of three replicates, and the sample size for each data point is specified within the respective figure. Source data are provided as a Source Data file.

A Photographic documentation and assessment of in vivo efficacy of FcP15, FcP15@β-CD, and commercial bactericide TC against rice bacterial leaf blight at 200 μg/mL. B Visual representation and assessment of in vivo efficacy of FcP15, FcP15@β-CD, and TC against rice bacterial leaf streak at 200 μg/mL. C Evaluation of phytotoxicity of FcP15 and FcP15@β-CD on rice plants at 500 μg/mL. In (A, B), the error bars show the mean ± standard error (SE), with distinct letters indicating significant differences as determined by one-way ANOVA and subsequent least significant difference (LSD) post-hoc testing (p < 0.05). The experiments were performed with a minimum of three replicates, and the sample size for each data point is indicated in the respective figure. Source data are provided as a Source Data file.

Visual documentation (A) and assessment of in vivo control activity (B) of FcP15, FcP15@β-CD, and TC against citrus bacterial canker at 200 μg/mL. C SEM images depicting deposition patterns of FcP15 and FcP15@β-CD on the citrus leaves. D Images of acute toxicity test toward zebrafish captured four days after exposure to control, FcP15, and FcP15@β-CD at 15 μg/mL. For (B), error bars indicate the mean ± standard error (SE), with different letters representing statistically significant differences, as determined by one-way ANOVA followed by the least significant difference (LSD) post-hoc test (n = 3, p < 0.05). The experiments were performed with at least three replicates. Source data are provided as a Source Data file.
References
-
- Fan, G. et al. Antimicrobial mechanisms of ZnO nanoparticles to phytopathogen Pseudomonas syringae: damage of cell envelope, suppression of metabolism, biofilm and motility, and stimulation of stomatal immunity on host plant. Pestic Biochem Phys194, 105455 (2023). - PubMed
-
- Ham, Y. & Kim, T. J. Anthranilamide from Streptomyces spp. inhibited Xanthomonas oryzae biofilm formation without affecting cell growth. Appl. Biol. Chem.61, 673 (2018).
MeSH terms
Substances
LinkOut - more resources
Full Text Sources
Medical
