. 2025 Mar 18;16(1):2640.
doi: 10.1038/s41467-025-58011-1.

Mediodorsal thalamus regulates task uncertainty to enable cognitive flexibility

Affiliations

Mediodorsal thalamus regulates task uncertainty to enable cognitive flexibility

Xiaohan Zhang et al. Nat Commun. .

Abstract

The mediodorsal (MD) thalamus is a critical partner for the prefrontal cortex (PFC) in cognitive control. Accumulating evidence has shown that the MD regulates task uncertainty in decision making and enhance cognitive flexibility. However, the computational mechanism of this cognitive process remains unclear. Here we trained biologically-constrained computational models to delineate the mechanistic role of MD in context-dependent decision making. We show that the addition of a feedforward MD structure to the recurrent PFC increases robustness to low cueing signal-to-noise ratio, enhances working memory, and enables rapid context switching. Incorporating genetically identified thalamocortical connectivity and interneuron cell types into the model replicates key neurophysiological findings in task-performing animals. Our model reveals computational mechanisms and geometric interpretations of MD in regulating cue uncertainty and context switching to enable cognitive flexibility. Our model makes experimentally testable predictions linking cognitive deficits with disrupted thalamocortical connectivity, prefrontal excitation-inhibition imbalance and dysfunctional inhibitory cell types.


Conflict of interest statement

Competing interests: The authors declare no competing interests.

Figures
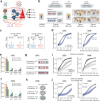
Fig. 1
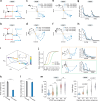
Fig. 1. The task-optimized PFC-MD model in decision making with parameterized cue uncertainty.
a Excitation-inhibition (E/I) recurrent neural network (RNN) for modeling the PFC-alone network, where three major prefrontal interneuron cell types were specified. The PFC-MD model consisted of two target-specific non-recurrent excitatory MD subpopulations and bidirectional MD-PFC projections. b Schematic of a cross-modal, cueing context-dependent decision-making task with working memory and divided attention components. Sensory cues were either conflicting LP/HP pulses or moving random dots. c Schematic of cueing context-dependent rule encoding. The RDM and CAC learned the same rule from different cueing modalities: attend-to-audition vs. attend-to-vision. d Psychometric curves of RDM and CAC contexts. Shaded areas denote SD, and the lines denote the mean derived from the parameter fit of a logistic function. Each condition was repeated 10 times with different input realizations yet with identical summary statistics. The PFC-MD model (black) outperformed the PFC-alone model (blue) in the presence of intermediate-to-high cue uncertainty, achieving a greater area under the psychometric curve (AUC). p = 0.00016, two-tailed rank-sum test for both panels. e Percentage of task error types in the CAC context under various cue uncertainty conditions. Error bar denotes SD (n = 10). For each correct/error group, all pairwise p-values were computed based on Bonferroni-corrected two-tailed rank-sum test (**p < 0.01, ***p < 0.001). f Similar to (e) but for the RDM context. Error bar denotes SD (n = 10). g Illustration of three types of cues with two congruence levels and two densities in the CAC context. h Illustration of three types of cues with two coherence levels and two densities in the RDM context. i Psychometric curve of the PFC-MD model under three different cue sparsity levels in the CAC and RDM contexts. The AUC statistics decreased with an increasing sparsity level. Shaded areas denote SD. j Psychometric curve comparison between the PFC-MD and PFC-alone models in the CAC and RDM contexts in a low cue sparsity condition. The PFC-MD outperformed the PFC-alone model in AUC (CAC: p = 0.00016; RDM: p = 0.00007, two-tailed rank-sum test). Shaded areas denote SD.
Fig. 2
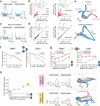
Fig. 2. Emergent neural representations of PFC and MD units from the task-optimized PFC-MD network.
a Two representative PFC excitatory units encoding two rules under two contexts. These two units were cue invariant units that encoded the same rule. Shaded areas around the PSTH denote the SD. b Two representative MD1 units encoding the cueing context. Shaded area around the PSTH denote the SD. c Two representative MD2 units encoding the cueing context. Shaded areas around the PSTH denote the SD. d Population statistics of mean firing rates (during the task delay period) of excitatory PFC units and MD units for encoding rule. Markers in dark/light color shade represent tuned/non-tuned units, respectively. e Similar to panel d, except for encoding context. f Two representative MD1 units that showed firing rate modulation with respect to cue uncertainty during both cueing and delay periods. Shaded areas around the PSTH denote the SD. g The same MD1 units also showed firing rate modulation with respect to cue sparsity. Shaded areas around the PSTH denote the SD. h Two representative PFC inhibitory units that showed firing rate modulation with respect to cue uncertainty. Shaded areas around the PSTH denote the SD. i Prefrontal neural sequences showed rule specificity and context invariance. Each heatmap shows the normalized peri-stimulus time histogram (PSTH) of selected prefrontal excitatory units of the task-optimized PFC-MD model during the delay period. In the first row, all units of all panels were sorted in the same order according to attend-to-vision tuning. In the second row, all units of all panels were sorted in the same order according to attend-to-audition tuning. The first and second columns demonstrated rule specificity, whereas the first and third columns demonstrated context invariance. j Population decoding analysis showed that the PFC population better encoded rule, whereas the MD population better encoded context. Accuracy is presented by mean ± SD (n = 20 Monte Carlo runs, 50 independent trials per run). ***p < 0.001, Bonferroni-corrected rank-sum test. k Increased in cue uncertainty caused decreased rule decoding accuracy (mean ± SD) for the PFC but did not affect context decoding accuracy for the MD. Error bar denotes SD (n = 20 Monte Carlo runs, 50 independent trials per run). In rule decoding, statistical tests were conducted independently for each group; all paired comparisons were statistically significant. ***p < 0.001, Bonferroni-corrected rank-sum test.
Fig. 3
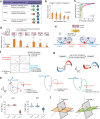
Fig. 3. Population representations from task-optimized PFC-MD and PFC-alone networks.
a Dynamics of population responses in the RDM context. The average population trajectory for a given condition and time was represented as a point in the state space. Responses from correct trials only were shown from the cue onset to the end of target period (80-ms step size), and were projected into the two-dimensional subspace capturing the variance according to the rule (attend-to-audition vs. attend-to-vision) and choice (see “Methods”). Units are arbitrary. The origin represents the cue onset. b Similar to (a) but for the CAC context. c, d Similar to (a, b), except for during the cueing period only. For a better illustration, three levels of cue uncertainty were shown by different shades of gray or blue color (dark/intermediate/light shade: low/medium/high cue uncertainty, respectively). e, f Similar to (c, d), except for a fixed cue uncertainty but different levels of cue sparsity. Three levels of sparsity were shown by different shades of gray or blue color (dark/intermediate/light shades: low/medium/high sparsity, respectively). g, h Comparison of neural velocity during both cueing and delay periods for different levels of cue uncertainty for the RDM and CAC contexts, respectively. The change of neural activity reduced to a low level during the delay period, reaching a fixed-point regime. i Fixed-point analysis in the three-dimensional PCA subspace revealed two “line-attractor-like” basins, with each basin representing a rule. Each cross symbol corresponded to a fixed point (color sorted by cue uncertainty). The red origin represents the cue onset. Inset: rotating the view angle and collapsing these points revealed two “fixed-point-like” attractors. j Similar to (d, f) in the CAC context, but from two PFC-alone networks with different psychometric curves. As expected, a better performance curve corresponded to better-separated neural trajectories and faster convergence speed to fixed points in the high cue uncertainty regime. Group statistics comparison between PFC-MD and PFC-alone networks (n = 20 models per group) on intrinsic network time constant (k) and degree of non-normality (l) estimated from their respective recurrent weight matrices. Center denotes mean, and error bar denotes SD. One-sided signed-rank tests showed their median statistics were significantly greater in the PFC-MD network (***, p = 5 × 10−48 for (k), p = 1 × 10−18 for l). m Quantification of the principal angle between MD and PFC subspaces with respect to various levels of cue uncertainty. There was an increasing trend in principal angle with increasing cue uncertainty (n = 20 Monte Carlo runs for each condition). Comparisons between neighboring conditions were highlighted (Bonferroni-corrected two-tailed rank-sum test).
Fig. 4
Fig. 4. MD activation enhances working memory maintenance in the PFC-MD network.
a Increasing the duration of task delay period reduced the task performance under cue uncertainty in both contexts. Statistics are presented in mean ± SD (n = 10 Monte Carlo runs). Statistical tests were conducted between green and blue curves (pointwise) for each delay duration condition (*p < 0.05, **p < 0.01, two-tailed rank-sum test). The task condition marked with “□” was used in the illustrations of the three remaining panels. b, c Increasing the MD1 or MD2 population firing rate during an elongated delay period improved the working memory and the psychometric curves (mean ± SD) in two contexts. Black curve denotes the baseline, and the number of % denotes the relative increase in subpopulation firing rate. Shaded area denotes SD (n = 10). With MD1 activation, the derived AUC increased from the baseline (RDM: dark blue vs. black, p = 0.016; light blue vs. black, p = 0.009; CAC: dark blue vs. black, p = 0.0001; light blue vs. black, p = 0.7 × 10−4; all by the two-tailed rank-sum test). With MD2 activation, the derived AUC increased from the baseline (RDM: dark blue vs. black, p = 0.028; light blue vs. black, p = 0.009; CAC: dark blue vs. black, p = 0.0001; light blue vs. black, p = 0.0002). d Decreasing the MD1 population firing rate degraded the working memory and the psychometric curves of two contexts. Shaded area denotes SD (n = 10). With MD1 suppression, the derived AUC increased from the baseline (RDM: dark gray vs. black, p = 0.014; light gray vs. black, p = 0.009; CAC: dark gray vs. black, p = 0.0003; light gray vs. black, p = 0.7 × 10−4). e Left: Weakening MD1→PV connections (by increasing the percentage of zeros) during the cueing period quickly reduced the task performance in both RDM and CAC contexts. Right: increasing MD1 activity (dotted line) could rescue each context’s performance under a wide range of connectivity conditions (shaded area: 20%-50% of zeros). Statistics are presented in mean ± SD (n = 10 Monte Carlo runs). Statistical tests were conducted between dark blue and light blue curves (pointwise) for condition (*p < 0.05, **p < 0.01, ***p < 0.001, two-tailed rank-sum test). f Weakening MD2→VIP connections only degraded the task performance slowly in both RDM and CAC contexts, but increasing MD2 activity had no or little effect on the change in task performance. Statistics are presented in mean ± SD (n = 10 Monte Carlo runs). Statistical tests are similar to (e). g Impact of network time constant under different thalamocortical connectivity manipulations. Statistics are presented in mean ± SD (n = 20 independently trained PFC-MD models). The MD1 and MD2 enhancement corresponded to the experiments where respective thalamocortical connections were strengthened during working memory. All statistical tests were two-tailed rank-sum tests against the PFC-MD baseline (MD-lesioned vs. baseline: p = 5 × 10−45; enhanced MD1 vs. baseline: p = 3 × 10−17; enhanced MD2 vs. baseline: p = 1 × 10−36; Bonferroni-corrected rank-sum test).
Fig. 5
Fig. 5. Parsing cognitive deficits and probing mechanistic causes in PFC-MD networks.
a Tuning curves of four selective PFC excitatory units (indicated by different colors) during the control condition. These four units showed rule tunings (“attend-to-vision” vs “attend-to-audition”). b At the population level, mean firing rate (FR) comparison of PFC excitatory units between two rules during delay (left panel) and target (right panel) periods. Four units are labeled in the same color in (a). Inset: Curves of probability density function (pdf, orange) and cumulative distribution function (cdf, blue). c In the presence of prefrontal E/I imbalance (e.g., reduced inhibition), PFC excitatory units shown in (a) decreased their discriminability in rule tuning during both delay and target periods. d Similar to (b), except for the reduced inhibition condition. Comparing the cdfs of ΔFRv-a = FR (attend-to-vision)—FR (attend-to-audition) between (b) and (d) showed statistically significant differences (delay period: p = 4 × 10−7; target period: p = 4.8 × 10−15, Kolmogorov–Smirnov test). e Two-dimensional neural trajectory representations in the control and E/I imbalance conditions. Trajectories were generated from all correct and error trials. Orange dots: cue off and start of the delay period. Blue and red end points represent two rule representations, whereas dot and star symbols represent left and right choices, respectively. f Task performance decreased with reduced prefrontal SOM→VIP and SOM→PV connectivity. Statistics are presented in mean ± SD (n = 10 Monte Carlo runs). g Increasing mutual inhibition strengths between SOM and VIP neurons amplified the gain under a high cue sparsity. Statistics are presented in mean ± SD (n = 10 Monte Carlo runs). Activating the MD2→VIP pathway further facilitated amplification and improved task performance. Two shaded circles indicate the two conditions illustrated in (h). h In the case of RDM task of (g) (with cue sparsity 0.8), comparison of PFC excitatory unit tunings and two-dimensional neural trajectories between scale = 1 (light gray, baseline) and scale = 1.2 for bidirectional SOM-VIP connection strengths. In the latter case, single-unit rule tunings emerged, and population responses improved rule discriminability.
Fig. 6
Fig. 6. Modified PFC-MD model with imposed sparse corticothalamic connectivity.
a The modified PFC-MD model with assumed unbalanced MD subpopulations (as shown by two different circle sizes, where the size of MD1 is greater than the size of MD2) and sparser Exc→MD2 connectivity than Exc→MD1 connectivity (as shown by a weaker connection in dashed line). b Psychometric curves of task-optimized modified PFC-MD model in two contexts. Shaded areas denote the SD (n = 10 realizations). Mean AUC showed similar or statistically non-significant values compared to the model described in Fig. 1b (RDM: p = 0.496; CAC: p = 0.821, two-tailed rank-sum test). c Population statistics of mean firing rates (during the cueing period) of MD1 and MD2 units for encoding cue uncertainty. d Population statistics of mean firing rates (during the cueing period) of MD1 and MD2 units for encoding cue sparsity. e In the RDM context, MD1 activation, but not MD2 activation, improved task accuracy under cue uncertainty. MD1 or MD2 activation improved task performance under cue sparsity. Statistics are presented in mean ± SD (n = 10 Monte Carlo runs). Cue uncertainty comparison: Baseline vs. MD2 activation (p = 0.82); baseline vs. MD1 activation (p = 0.00016); MD2 vs. MD1 activation (p = 0.00016). Cue sparsity comparison: Baseline vs. MD2 activation (p = 0.00016); baseline vs. MD1 activation (p = 0.00016); MD2 vs. MD1 activation (p = 0.045), two-tailed Wilcoxon rank-sum tests. f Similar to (e), except in the CAC context. Statistics are presented in mean ± SD (n = 10 Monte Carlo runs). Baseline vs. MD2 activation (p = 0.16); baseline vs. MD1 activation (p = 0.00016); MD2 vs. MD1 activation (p = 0.00043). Cue sparsity comparison: baseline vs. MD2 activation (p = 0.00016); baseline vs. MD1 activation (p = 0.00016); MD2 vs. MD1 activation (p = 0.017), two-tailed Wilcoxon rank-sum tests. g When both cue uncertainty and cue sparsity were present, MD1 or MD2 activation alone couldn’t improve task performance, but activation of both MD subpopulations could. Statistics are presented in mean ± SD (n = 10 Monte Carlo runs). Baseline vs. co-activation, *, p = 0.011; ***, p = 0.00015, two-tailed Wilcoxon rank-sum tests. Other paired comparisons were n.s.
Fig. 7
Fig. 7. Thalamocortical plasticity in the PFC-MD model enabled rapid context switching.
a Schematic diagram of the context-switching task (Context 1→Context 2→Context 1’). b Relative learning speed in context switching, where neural plasticity of local MD-PFC connectivity was induced in trial-by-trial learning of Context 2 and Context 1’. Error bar denotes s.e.m. (n = 20 independently trained models). Relative learning speed comparisons: Context 1 vs. Context 2 (p = 1.9 × 10−6, two-tailed rank-sum test); Context 2 vs. Context 1’ (p = 0.003, two-tailed rank-sum test). c Heatmap of connectivity of MD (MD1 and MD2) to prefrontal excitatory (Exc) units. Let W denote the MD-to-Exc connection matrix, units were sorted based on the change of ΔW = Wcontext 2-Wcontext 1. According to the synaptic change ΔW, PFC excitatory units were mapped to two functional cell types: rule tuned (red and blue) vs. non-tuned (green) units. d Tuning curve examples of rule tuned (blue) and non-tuned (green) PFC units. Shaded area denotes the task delay period. Shaded areas around the PSTH denote the SD. e PFC excitatory units showed context-invariant rule-specific sequential activity during the delay period. Each row of the heatmap corresponded to the normalized trial-averaged firing activity. Units were sorted based on the location of peak firing rates and ranked in the same order in all six panels. f The E/I input of PFC excitatory units during the task delay period were clustered according to the PFC rule tuning properties when the PFC-MD network succeeded to learn the context switch. The cluster structure was lost when the PFC-MD network failed to learn the context switch. Units are color coded using the same color scheme based on rule-tuned (red and blue) or non-tuned (green) property in panel (c). g Quantification of mean synaptic plasticity (error bar: s.e.m., the number of connections for each colored bar, n = 3690, 3690, 306, 306, 3690, 3690, respectively) in bilateral MD-PFC connections during two consecutive context-switching conditions. In general, MD1→Exc, MD2→Exc, and Exc→MD2 connections showed the overall smallest changes, whereas Exc→MD1 and MD2→VIP connections showed the overall dominant changes. All p-values from pairwise comparisons were based on the two-tailed rank-sum test (*p < 0.05, ***p < 0.001). h MD units showed context-invariant firing. Note that some MD units (overlaid “×” symbols) preserved their mean firing rates during the delay period between Context 1 and Context 1’. i Turning curve illustrations of one MD unit during context switching. Shaded area denotes the task delay period. Note the strong context modulation between different contexts, but little modulation with respect to the rule. j A subset of MD units (n = 8 out of 30 units from one trained PFC-MD model) showed increased modulation with respect to decision error during the transient switching stage. Statistics are presented in mean ± SD. The mean MD firing rate was averaged across the delay period when the change of network state became very small (i.e., steady state). Tuning curves of one MD were shown on the top. k Comparison of neural trajectories of PFC population dynamics during cueing and delay periods between conditions in which the PFC-MD model succeeded or failed to learn context switching. Trajectories were color coded to represent time from the cue onset to the end of delay.
Fig. 8
Fig. 8. Computational and geometric insight of MD in regulating prefrontal computation to learn context switching.
a Schematic summary of cell type and task-phase specific regulatory roles of MD thalamus in decision making under cue uncertainty. b Comparison of relative context switch time with different sizes of MD population. All time was normalized with respect to the baseline (MD size of 32). Error bar denotes s.e.m. (n = 10 independently trained models). All statistical tests were two-tailed rank-sum tests against the baseline (NMD = 2 vs. baseline: p = 0.0036; NMD = 8 vs. baseline: p = 0.0052; Bonferroni-corrected rank-sum test; NMD = 16, 24 vs. baseline, n.s.). c Ratio of explained variance of PFC and MD populations derived from task-optimized PFC-MD models. Our computer simulations and principal component analysis (PCA) showed that the recurrent PFC structure had a larger dimensionality than the feedforward MD structure. Error bar denotes s.e.m. (n = 10 independently trained models). Statistical tests were conducted between PFC and MD regarding the ratio of explained variance based on #principal components (PCs). The first three points were used to illustrate the differences based on two-tailed rank-sum tests (p = 0.003 for the first PC; p = 0.0015 for the second PC; p = 0.012 for the third PC). d Comparison of relative context switch time with different assumptions of modifiable connectivity during switch. In the top, unilateral or bilateral PFC, MD and input connectivity patterns are shown (∅ denotes no connectivity). In total, there are five unidirectional connections that can be adapted. In the bottom, all time in the y-axis was normalized with respect to the baseline (unchanged intracortical connectivity). Error bar denotes s.e.m. (n = 10 independently trained models). All statistical tests were two-tailed rank-sum tests against baseline (the respective p-values from left to right are 0.0002, 0.0002, 0.0233, 0.0007, 0.0025, and 0.4497). e Schematic illustration of the MD’s role in context switch during cue-to-rule remapping, and the PFC is illustrated as a bistable attractor. f Two-dimensional (2D) vector field that illustrates the bistable PFC dynamics as an approximate line attractor. The diagonal dotted line represents an attractor boundary for neutral stimuli (e.g., #LP = #HP). Rotating the 2D vector field by 180 degrees is equivalent to switching the cue-to-rule transformation while preserving the PFC dynamics. g Comparison of PFC population dynamics under Context 1 and Context 2 while projecting them onto the same PCA subspace. The neural trajectories were nearly orthogonal to each other. Each color trace represents a single trial with specific cue input (#LP > #HP or #LP < #HP). Light to dark color represents the time evolution of the trial. h Left panel: Comparison of neural trajectories of PFC dynamics in Context 1, Context 2 with successful context switching, and Context 2 with unsuccessful context switching. Middle panel: Comparison of neural trajectories of PFC dynamics in Context 2 with successful context switching and Context 2 with MD2 lesion. Right panel: Comparison of neural trajectories of PFC dynamics in Context 2 with MD2 lesion and Context 2 with MD2 lesion plus MD1 stimulation. i Quantification of the principal angles of PFC-PFC and MD-MD subspaces during consecutive context switching (n = 5 independently trained PFC-MD models; orange dot represents the trained PFC-MD model used in Fig. 7 illustration). Principal angles were computed across trials during the cueing period. The angles were relatively large between two different contexts (1 vs. 2 or 2 vs 1’), whereas the angles were smaller between two similar contexts (1 vs 1’). j Geometric illustration of rotation of neural subspaces during two consecutive context switches. The angles of PFC-PFC and MD-MD changed in a coordinated manner.
Fig. 9
Fig. 9. Computational prediction and experimental testing on a schizophrenia mouse model.
a Reduced cortical inhibition or E/I imbalance in the trained PFC-MD model caused sensitivity to the noise during the task delay period, resulting in decreased task performance (p = 0.0067, noiseless vs. noise in control model, two-sided signed-rank test; p = 0.0019, noiseless vs. noise in E/I imbalance model, two-sided signed-rank test; the control model’s performance was 1 in a noiseless condition). MD activation significantly improved the task performance in the presence of noise and E/I imbalance (p = 0.0019, noise vs. MD activation, two-sided signed-rank test). The illustration was shown for the CAC task, but the result was qualitatively similar for the RDM task. Statistics are presented in mean ± s.e.m. (n = 10 independent Monte Carlo runs). b Reduced cortical inhibition in the trained PFC-MD model caused switching deficit during the reversal context-switching task (Context 1Context 2). The E/I imbalanced model had significantly greater switch time (p = 0.0019; two-sided signed-rank test), and MD activation rescued the switching deficit (p = 0.0019; two-sided signed-rank test). Statistics are presented in mean ± s.e.m. (n = 10 independent Monte Carlo runs). c Reduced cortical inhibition in the trained PFC-MD model caused switching deficit in a cross-modal cueing context switching task (CAC context→RDM context), which had significantly greater switch time than control model (p = 0.0019; two-sided signed-rank test). Similarly, MD activation rescued the switching deficit (p = 0.0019; two-sided signed-rank test). Statistics are presented in mean ± s.e.m. (n = 10 independent Monte Carlo runs). d Reduced cortical inhibition in the trained PFC-MD model caused slower relative reaction time (p = 0.0019; two-sided signed-rank test). MD activation improved reaction time (p = 0.0019; two-sided signed-rank test). Statistics are presented in mean±s.e.m. (n = 10 independent Monte Carlo runs). e Schematic of MD→PFC anterograde labeling strategy for output targets of MD neurons in the PFC of wild type (WT) and 22Q11DS mice. Representative image of PFC showing trans-synaptic labeling. Scale bar = 200 μm. f Representative images of immunohistochemically labeled parvalbumin (PV) neurons (top panel) and their overlap with mCherry+ MD output neurons (bottom panel) in WT and 22Q11DS mice. The lower degree of overlap in 22Q11DS mice suggests that reduced prefrontal inhibition. Scale bar = 200 μm. g Quantification of percentage of anterogradely labeled neurons which co-express PV revealed reduced innervation of PV neurons in 22Q11DS mice, which is equivalent to E/I imbalanced due to reduced cortical inhibition (n = 3 animals for each group; *p = 0.032; two-tailed rank-sum test). h Schematic of task design with cross-modal cue switching component (adapted from REF). i Optogenetic MD activation through SSFO (stabilized step function opsin) across the cueing and delay periods for 5 consecutive trials during the switch improved animals’ behavioral switching latency in 22Q11DS mice (n = 19 sessions from 4 22Q11DS mice; **p = 0.0095, two-tailed rank-sum test). For box plots in (g, i), boundaries, 25−75th percentiles; midline, median; whiskers, minimum–maximum.

Similar articles

Cited by

References

    1. Uddin, L. Q. Cognitive and behavioural flexibility: neural mechanisms and clinical considerations. Nat. Rev. Neurosci.22, 167–179 (2021). - PMC - PubMed
    1. Bach, D. R. & Dolan, R. J. Knowing how much you don’t know: a neural organization of uncertainty estimates. Nat. Rev. Neurosci.13, 572–586 (2012). - PubMed
    1. Mushtaq, F., Bland, A. R. & Schaefer, A. Uncertainty and cognitive control. Front. Psychol.2, 249 (2011). - PMC - PubMed
    1. Fetsch, C. R., Pouget, A., DeAngelis, G. C. & Angelaki, D. E. Neural correlates of reliability-based cue weighting during multisensory integration. Nat. Neurosci.15, 146–154 (2012). - PMC - PubMed
    1. Zhou, Y., Acerbi, L. & Ma, W. J. The role of sensory uncertainty in simple contour integration. PLoS Comput. Biol.16, e1006308 (2020). - PMC - PubMed

LinkOut - more resources