

Atherogenic index of plasma identifies subjects with severe liver steatosis
- PMID: 40097487
- PMCID: PMC11914574
- DOI: 10.1038/s41598-025-93141-y
Atherogenic index of plasma identifies subjects with severe liver steatosis
Abstract
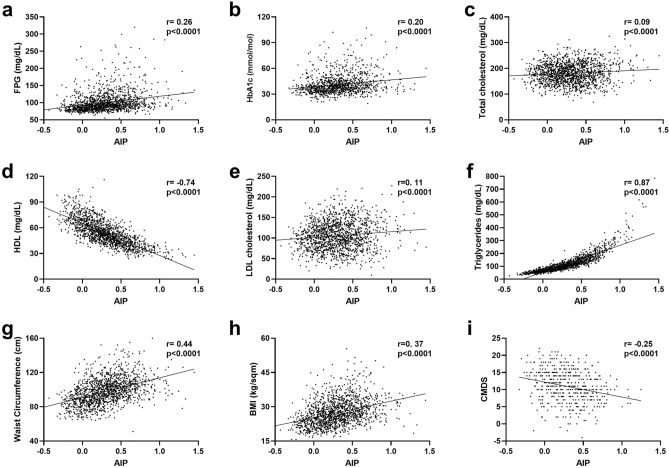
The Atherogenic Index of Plasma (AIP), calculated by log (Triglycerides/HDL-C), has been proposed as a marker of atherogenic and cardiovascular risk. Atherosclerosis and Metabolic Dysfunction-Associated Steatotic Liver Disease (MASLD) share some pathogenic features and may be considered clinical manifestations of Metabolic Syndrome. In this study, we aimed to investigate the role of increased AIP as a putative metabolic biomarker for MASLD. 1,496 individuals (49% males and 51% females) underwent clinical examination for Metabolic Syndrome at Internal Medicine Division "C. Frugoni" of University Hospital of Bari, Italy in the period between January 2016 and April 2024. Clinical history was recorded, and physical examination, anthropometric measures, biochemical assessment, and abdomen ultrasound were performed. In the overall population, AIP significantly correlated with fasting glycemia (FPG, r = 0.26, p < 0.0001), HbA1c (r = 0.20, p < 0.0001), LDL (r = 0.11, p < 0.0001) and total cholesterol (r = 0.09; p < 0.0001), and anthropometric measures of obesity BMI (r = 0.37, p < 0.0001) and Waist Circumference (r = 0.44; p < 0.001). We then investigated AIP values in patients with and without dysmetabolic conditions, finding that AIP significantly increased as steatosis worsened (p < 0.001). ROC curves identified an optimal cut-off of 0.31 for accurately diagnosing severe steatosis and AIP values above this cut-off discriminated patients with significantly increased (p < 0.0001) fasting glycemia, LDL, and waist circumference, and were strongly associated (p < 0.0001) with MASLD (LLR 85.3), type 2 diabetes (LLR 85.5), abdominal obesity (LLR 72.9), overweight (LLR 151.8), and systemic obesity (LLR 178.4). The risk for being diagnosed with such conditions was found to be even higher in the subpopulation of patients with severe liver steatosis. To validate our findings, we considered another cohort of patients with and without biopsy-proven liver steatosis (public dataset GSE89632), confirming that a significant increase (p < 0.001) in AIP values could be found in patients with liver steatosis compared to healthy controls. AIP can be considered a specific biomarker of fatty liver disease with high sensitivity for the diagnosis of the severe form of liver steatosis. Considering AIP in the evaluation of patients with liver steatosis may augment the accuracy for diagnosing metabolic impairment and MASLD.
Keywords: Atherosclerosis; Diabetes; MASLD; Mediterranean diet; Metabolic syndrome; Obesity.
© 2025. The Author(s).
Conflict of interest statement
Declarations. Competing interests: The authors declare no competing interests. Ethics approval and consent to participate: The study was approved by the Ethics Committee of the Azienda Ospedaliero-Universitaria Policlinico di Bari (Bari, Italy) in accordance with the requirements of the Declaration of Helsinki. Reference number: n.311, MSC/PBMC/2015. Written informed consent for the use of clinical data was obtained from all participants in the study. In accordance with the approved Ethics Committee, only patients who were already 18 years old or more were included.
Figures


References
-
- Dobiás̆ová, M. & Frohlich, J. The plasma parameter log (TG/HDL-C) as an atherogenic index: Correlation with lipoprotein particle size and esterification rate inapob-lipoprotein-depleted plasma (FERHDL). Clin. Biochem. 34(7), 583–588 (2001). - PubMed
MeSH terms
Substances
Grants and funding
- PON "RICERCA E INNOVAZIONE" 2014-2020-Innovazione (D.M. 10 AGOSTO 2021, N. 1062)/Regione Puglia
- CUP H93C22000430007/Ministero dell'Università e della Ricerca
- CUP H33C22000680006/Ministero dell'Università e della Ricerca
- CUP H93C22000780006/Ministero dell'Università e della Ricerca,Italy
- Id. 23239/Fondazione AIRC per la ricerca sul cancro ETS
LinkOut - more resources
Full Text Sources
Medical
Miscellaneous
