. 2025 Mar 17;15(1):9060.
doi: 10.1038/s41598-025-93288-8.

Measuring the effect of repetitive stretching on the deformability of human red blood cells using optical tweezers

Affiliations

Measuring the effect of repetitive stretching on the deformability of human red blood cells using optical tweezers

Tuna Pesen et al. Sci Rep. .

Abstract

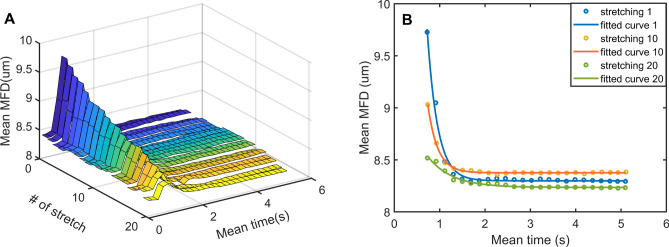
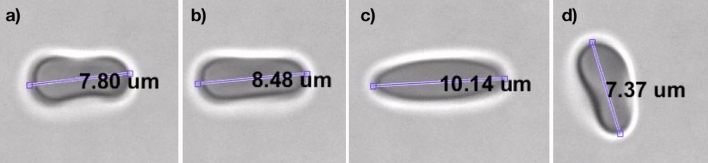
Mechanical features of cells play a crucial role in many biological processes such as crawling, proliferation, spreading, stretching, contracting, division, and programmed cell death. The loss of cell viscoelasticity underlines different types of diseases such as cancer, sickle cell, malaria, and diabetes mellitus. To understand the loss of viscoelasticity, mechanical responses of various kinds of cells to stress or strain are under investigation. Especially red blood cells (RBCs) or erythrocytes are one of the simple structured cells such that the effects of stress or strain could be easily assessed. With their viscoelastic nature, they can deform by preserving cell integrity when passing through blood vessels that are smaller than their size. In this study, we investigated the mechanical response of RBCs under repetitive stretching-relaxation cycles and examined some of the universal cytoskeleton laws at the single cell level over the whole body. For this, the individual RBCs were exposed to repetitive biaxial stretch-relaxation cycles of 5 s duration by optical tweezers to assess their mechanical response. According to the findings, the cells became stiffer with each stretch and became completely undeformable after a certain number of stretch-relaxation cycles. We observed that with the increasing number of stretching cycles, cell stiffness changed as a sign of weak power law, implying cell rheology is scale-free and decay times were increased, showing the transition from fast to slow regime. In addition, the appearance of the cells became non-uniform with darker areas in some parts and highly elongated shape in the most extreme cases.

Keywords: Cell mechanics; Cytoskeleton; Red blood cell.


Conflict of interest statement

Competing interests: The authors declare no competing interests.

Figures

Fig. 1
Fig. 1
(a) Change of formula image and formula image with the number of stretches. (b) Change of formula image with the number of stretches. The adjusted R-squared value of the fit is 0.96 and n indicates the number of cells. (c) Change of formula image with the number of stretches. The exponent of the exponential fit revealed 0.074 with the R-squared value of 0.98. Each data point in all figures indicates the mean of 34 cells.
Fig. 2
Fig. 2
(a) Change of Feret diameter during the stretching and the recovery processes with time. Each ribbon line represents the mean MFD of the 34 cells for the corresponding stretching #, (b) The exponential fit result of the relaxation data of the cells. Open circles represent the experimental data and the solid curves are the exponential fit to the data. The data shows the relaxation process of the 1st, 10th and 20th stretching of the cells (of 34). Decay times of the fit curves are 203 ms (stretching 1), 215 ms (stretching 10), 518 ms (stretching 20) with the corresponding R-squared values; 0.98, 0.99 and, 0.97.
Fig. 3
Fig. 3
Mean decay time, formula image, of RBCs corresponding to each stretching number. The slope of the first fit line is 0.0038 and the slope of the second fit line is 0.0705. Each data point represents average of 34 cells.
Fig. 4
Fig. 4
(a) Mean permanent deformation, formula image, of the 34 RBCs are shown for each stretching number. All the data points were below the formula image line. This indication was interpreted as a solid-like behavior of the RBCs, (b) Exponential fit (red line) to formula image revealed formula image with the R-squared value of 0.95, n indicates number of the cells.
Fig. 5
Fig. 5
Effect of repetitive stretching on the membrane morphology of the selected four RBCs. The images were demonstrated in terms of the grayscale images and the colorcube color bar (of MATLAB). The first two rows show the cells before stretching, while the last two rows show the cells after being stretched 20 times. Concentric circles are seen on the unstretched cells, while this structure is distorted on the 20-times-stretched cells in the colorcube color bar.
Fig. 6
Fig. 6
(a1) A single RBC before stretching while the optical trap is off, a2) while the optical trap is on but not moving, (a3a6) first stretching-relaxation cycle of the cell, (b1) The cell after being 12 times stretched and relaxed while trap is off, b2) while the trap is on but not moving, (b3b6) the 13th stretching-relaxation cycle of the cell, (c1) the cell after 13th stretching, (c2c5) the 14th stretching of the cell, (d1d2) the cell after 14 times stretched while the trap is off.
Fig. 7
Fig. 7
The distribution of inital RBC cell size with a normal Kernel fit. The area under the curve is normalized to 1, the bandwidth of the fit is 0.2500 and, n is the total number of RBCs.
Fig. 8
Fig. 8
(a) Side view of a optically trapped RBC by focused laser beams. (b) Top view of a optically trapped RBC before and during the stretching. The red dots on the cells show the positions of the laser foci.
Fig. 9
Fig. 9
(a) The optically trapped RBC before the stretching, (b) the stretched RBC after the experiment is started, (c) the maximum stretched RBC just before escaping from the trap, (d) the relaxed RBC after escaping from the moving trap.
Fig. 10
Fig. 10
Change of Maximum Feret Diameter of an RBC during a stretching-relaxation process.

References

    1. Smith, A. S. et al. Myosin iia interacts with the spectrin-actin membrane skeleton to control red blood cell membrane curvature and deformability. Proc. Natl. Acad. Sci.115, E4377–E4385 (2018). - PMC - PubMed
    1. Dao, M., Lim, C. T. & Suresh, S. Mechanics of the human red blood cell deformed by optical tweezers. J. Mech. Phys. Solids51, 2259–2280 (2003).
    1. Qiang, Y., Liu, J., Dao, M., Suresh, S. & Du, E. Mechanical fatigue of human red blood cells. Proc. Natl. Acad. Sci.116, 19828–19834 (2019). - PMC - PubMed
    1. Lux, S. E. Anatomy of the red cell membrane skeleton: Unanswered questions. Blood127, 187–199 (2016). - PubMed
    1. Pesciotta, E. N. et al. A label-free proteome analysis strategy for identifying quantitative changes in erythrocyte membranes induced by red cell disorders. J. Proteomics76, 194–202 (2012). - PMC - PubMed

LinkOut - more resources