. 2025 Mar 17;8(1):450.
doi: 10.1038/s42003-025-07855-w.

Light cues drive community-wide transcriptional shifts in the hypersaline South Bay Salt Works

Affiliations

Light cues drive community-wide transcriptional shifts in the hypersaline South Bay Salt Works

Margaret M Weng et al. Commun Biol. .

Abstract

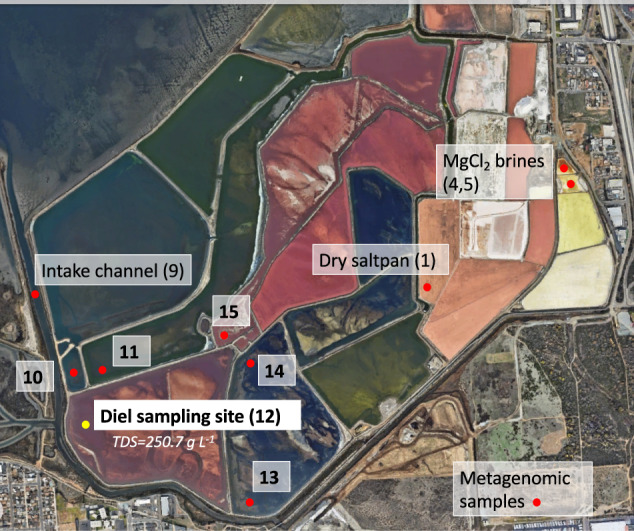
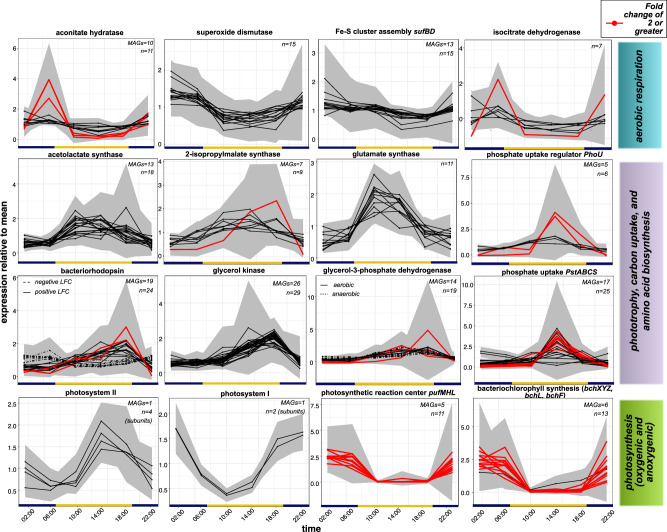
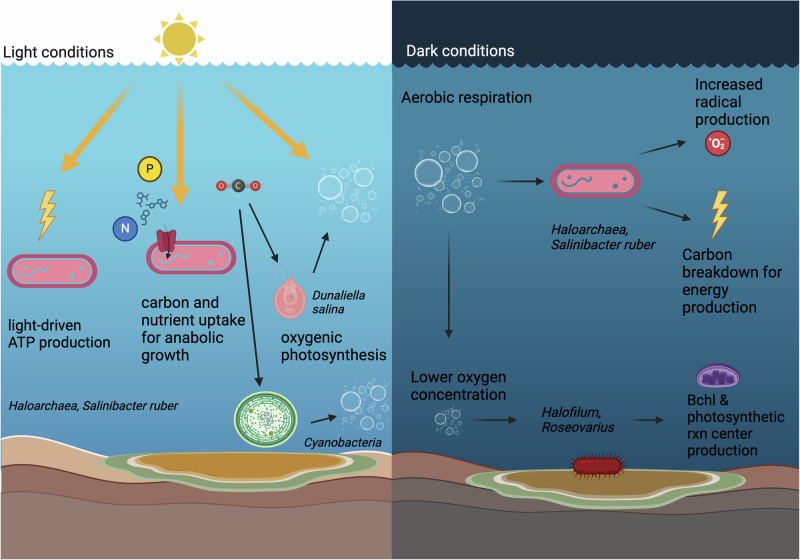
The transition from day to night brings sweeping change to both environments and the organisms within them. Diel shifts in gene expression have been documented across all domains of life but remain understudied in microbial communities, particularly those in extreme environments where small changes may have rippling effects on resource availability. In hypersaline environments, many prominent taxa are photoheterotrophs that rely on organic carbon for growth but can also generate significant ATP via light-powered rhodopsins. Previous research demonstrated a significant response to light intensity shifts in the model halophile Halobacterium salinarum, but these cycles have rarely been explored in situ. Here, we examined genome-resolved differential expression in a hypersaline saltern (water activity (aw) 0.83, total dissolved solids = 250.7 g L-1) throughout a 24-h period. We found increased transcription of genes related to phototrophy and anabolic metabolic processes during the day, while genes related to aerobic respiration and oxidative stress were upregulated at night. Substantiating these results with a chemostat culture of the environmentally abundant halophilic bacterium Salinibacter ruber revealed similar transcriptional upregulation of genes associated with aerobic respiration under dark conditions. These results describe the potential for light-driven changes in oxygen use across both a natural hypersaline environment and a pure culture.


Conflict of interest statement

Competing interests: The authors declare no competing interests.

Figures

Fig. 1
Fig. 1. Aerial view of the South Bay Salt Works.
Red dots indicate sites where DNA was sampled for metagenomic and amplicon sequencing. The yellow dot indicates the site of diel metatranscriptomic sampling. Image retrieved from Google Earth on 05/27/2024.
Fig. 2
Fig. 2. Top prokaryotic and eukaryotic taxa in the lake chosen for diel sampling.
Represented by 16S rRNA gene abundance (prokaryotes) and 18S rRNA gene abundance (eukaryotes and fungi). Sediment and mat samples had <1000 total 18S reads and were excluded from further analyses. 16S and 18S rRNA gene abundances for all lakes at SBSW can be found in Supplementary Fig. 3. Hellinger transformation (square root of relative abundance) was used for color gradients for better visualization of rarer taxa, but dendrograms are based on untransformed relative abundance.
Fig. 3
Fig. 3. MAGs with the highest number of mapped transcripts in the dataset.
Shown as a proportion of the total reads recovered for each sample. Two genes representing ribosomes that were unsuccessfully filtered by ribodepletion, NODE_1943_length_16146_cov_30.276739_pgaptmp_000182 and NODE_2703_length_14133_cov_19.928612_pgaptmp_000886, were removed from the dataset before these calculations. Ribosomal identity was confirmed via manual BLAST searches. MAGs whose transcript counts were less than 0.5% of total reads in a sample are shown as “Other”.
Fig. 4
Fig. 4. Overview of differential expression from day to night.
A MA plot of mean transcription vs log2 fold change for all genes in the SBSW dataset where each point represents one of 180,973 genes in the dataset. Negative log2 fold changes correspond to upregulation at night, while positive fold changes correspond to upregulation during the day. Red dots denote a Benjamini-Hotchberg adjusted p-value < 0.05. B PCA plot showing sample variation driven by the top 500 most variable genes, as selected by overall range in value between samples. This subset was chosen to validate whether the greatest differences between samples were indeed caused by a shift from day to night. Each point represents a replicate dataset used in our analysis. Percentages in axes represent the degree of between-sample variance explained by that axis.
Fig. 5
Fig. 5. Relative expression patterns for genes of interest at SBSW.
Lines indicate expression level relative to the base mean transcription of significantly differentially expressed genes, as calculated by DESeq2. Lines in red highlight genes with a fold change of 2 or higher (corresponding to log2 fold change value of ±1 or greater). Gray shading indicates standard error across six replicate samples for each time point. The total number of differentially expressed genes (Benjamini-Hotchberg adjusted p-value < 0.05, n) and the number of MAGs containing these genes (if these differ) is noted on the top right-hand corner of each plot.
Fig. 6
Fig. 6. Comparison of gene expression between Salinibacter ruber MAGs assembled from SBSW and cultured Salinibacter ruber.
Positive log2 fold change indicates upregulation under light conditions, while negative log2 fold change indicates downregulation under light conditions. Genes shown were either identified as genes of interest from SBSW analysis or had the greatest log2 fold change and/or the smallest p-values in the Salinibacter ruber culture experiment.
Fig. 7
Fig. 7. Proposed shifts in metabolic activity between day and night at SBSW.
Created in BioRender. Weng, M. (2025) https://BioRender.com/q56f501.

References

    1. Dvornyk, V., Vinogradova, O. & Nevo, E. Origin and evolution of circadian clock genes in prokaryotes. Proc. Natl. Acad. Sci. USA100, 2495–2500 (2003). - PMC - PubMed
    1. Tseng, R. et al. Structural basis of the day-night transition in a bacterial circadian clock. Science355, 1174–1180 (2017). - PMC - PubMed
    1. Mohr, W., Intermaggio, M. P. & LaRoche, J. Diel rhythm of nitrogen and carbon metabolism in the unicellular, diazotrophic cyanobacterium Crocosphaera watsonii WH8501. Environ. Microbiol.12, 412–421 (2010). - PubMed
    1. Klatt, C. G. et al. Temporal metatranscriptomic patterning in phototrophic Chloroflexi inhabiting a microbial mat in a geothermal spring. ISME J.7, 1775–1789 (2013). - PMC - PubMed
    1. Becker, K. W. et al. Combined pigment and metatranscriptomic analysis reveals highly synchronized diel patterns of phenotypic light response across domains in the open oligotrophic ocean. ISME J.15, 520–533 (2021). - PMC - PubMed