. 2025 Sep;32(9):1812-1824.
doi: 10.1038/s41594-025-01517-5. Epub 2025 Mar 17.

Molecular glues that inhibit deubiquitylase activity and inflammatory signaling

Affiliations

Molecular glues that inhibit deubiquitylase activity and inflammatory signaling

Francesca Chandler et al. Nat Struct Mol Biol. 2025 Sep.

Abstract

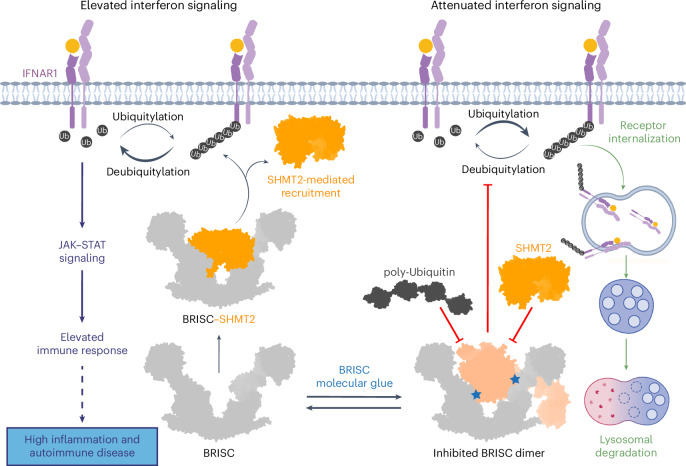
Deubiquitylases (DUBs) are crucial in cell signaling and are often regulated by interactions within protein complexes. The BRCC36 isopeptidase complex (BRISC) regulates inflammatory signaling by cleaving K63-linked polyubiquitin chains on type I interferon receptors (IFNAR1). As a Zn2+-dependent JAMM/MPN (JAB1, MOV34, MPR1, Pad1 N-terminal) DUB, BRCC36 is challenging to target with selective inhibitors. Here, we discover first-in-class inhibitors, termed BRISC molecular glues (BLUEs), which stabilize a 16-subunit human BRISC dimer in an autoinhibited conformation, blocking active sites and interactions with the targeting subunit, serine hydroxymethyltransferase 2. This unique mode of action results in selective inhibition of BRISC over related complexes with the same catalytic subunit, splice variants and other JAMM/MPN DUBs. BLUE treatment reduced interferon-stimulated gene expression in cells containing wild-type BRISC and this effect was abolished when using structure-guided, inhibitor-resistant BRISC mutants. Additionally, BLUEs increase IFNAR1 ubiquitylation and decrease IFNAR1 surface levels, offering a potential strategy to mitigate type I interferon-mediated diseases. Our approach also provides a template for designing selective inhibitors of large protein complexes by promoting rather than blocking protein-protein interactions.


Conflict of interest statement

Competing interests: E.Z., R.G., J.M.S. and F.S. are coinventors on a patent to use BRISC inhibitors as therapeutics (WO2024115713A1). J.M.S. owns equity in Alliance Discovery and the Barer Institute and consults for Syndeavor Therapeutics. The remaining authors declare no competing interests.

Figures

Fig. 1
Fig. 1. Fluorescence-based screen to identify first-in-class JAMM inhibitors.
a, Left, schematic of a TAMRA-linked IQF diubiquitin substrate. Ub, ubiquitin. Right, reaction progress curve of BRISC DUB activity. Data points are the mean ± s.e.m. of two independent experiments carried out in technical duplicate. b, Z-score normalization of 320 compounds from an in-house kinase-directed inhibitor library and identification of hit compounds in wells H20 and P12. c, Chemical structures of AT7519 and two isomers with an additional 2,6-dichlorobenzoyl moiety. d, Dose–response inhibition of BRISC activity by the H20 compound and the two potential isomers, AP-5-144 and JMS-175-2. e, Dose–response inhibition of trypsin, USP2 and JAMM/MPN DUB enzymes AMSH*, BRISC, ARISC and BRCC36–Abraxas 2 by JMS-175-2. f, Chemical structure of the FX-171-C compound. g, As in e, but for FX-171-C. Data points in d,e,g are the mean ± s.e.m. of three independent experiments carried out in technical duplicate. Source data
Fig. 2
Fig. 2. Inhibitors stabilize a BRISC dimer.
a, Mass photometry histograms of purified BRISC in absence (DMSO, left) and presence (JMS-175-2, middle; FX-171-C, right) of inhibitors. Insets, corresponding negative-stain EM 2D classes of BRISC mixed with DMSO or inhibitors. b, Left, cryo-EM density map of a BRISC monomer with a BRISC model (PDB 6H3C) rigid-body fitted (dust cleaning size: 7.4, map threshold: 0.0907). Right, cryo-EM density map of a BRISC dimer with two BRISC models rigid-body fitted. Maps are outputs from nonuniform refinement in cryoSPARC.
Fig. 3
Fig. 3. Cryo-EM structures of inhibited BRISC dimers.
a, Cryo-EM density map of BRISC–FX-171-C costructure at 3.0 Å. BRISC monomers are shown as gray and salmon cartoon models and fitted to the cryo-EM map shown as a transparent surface at a 0.00224 threshold. The C termini of BRCC45 (residues 275–383) and MERIT40 are rigid-body fitted into the density. b, BRISC–FX-171-C cryo-EM density map at a 0.0165 threshold. BRISC subunits are colored by chain. The density corresponding to FX-171-C is colored orange and highlighted in orange boxes. The maps shown in ac are locally filtered maps generated using RELION local resolution estimation. c, Close-up views of the indicated inhibitor density comparing binding sites for FX-171-C (left) and JMS-175-2 (right). d, Cryo-EM density at the equivalent sites of BRCC36, Abraxas 2 and BRCC45′ in the BRISC–FX-171-C costructure, where there is no dimer interface and no additional density corresponding to FX-171-C. The maps in ad had dust cleaning (size 7.1) applied in ChimeraX. e, Structures of FX-171-C and JMS-175-2 modeled in state 1 and state 2. Cryo-EM density of the inhibitor after focused refinement represented as a mesh and displayed using the surface zone tool (FX-171-C, radius = 2.6; JMS-175-2, radius = 2.2) in ChimeraX.
Fig. 4
Fig. 4. Analysis of the BLUE compound-binding site.
a, Ball-and-stick model of FX-171-C and JMS-175-2 binding to BRCC36, Abraxas 2 and BRCC45. Hydrogen bonds are shown as black dashed lines and residues studied by mutagenesis are indicated. b, The BLUE compound-binding pocket shown as a surface and colored by hydrophobicity. c, FX-171-C inhibition of BRISC DUB activity with BRCC36 (left), Abraxas 2 (middle) and BRCC45 (right) mutants. d, SHMT2 inhibition of the same BRISC mutants as in c. Data in c,d are the mean ± s.e.m. of three independent experiments carried out in technical duplicate. Source data
Fig. 5
Fig. 5. BLUE compounds reduce ISG expression and IFNAR1 internalization in cells.
a, THP-1 cells were treated with or without human (h)IFNα2 (25 ng ml−1) and 4 μM inhibitor (JMS-175-2, FX-171-C or FX-171-A), 4 μM negative control (AP-5-145), DMSO control (0.1%) or JAK–STAT inhibitor tofacitinib (0.4 μM) for 16 h. Luciferase analysis of the ISRE in THP-1 supernatant in relative light units (RLU). Data points are from four independent experiments. bf, MCF10A Cas9 cells expressing BRCC45 WT and BRCC45 R137A were treated with hIFNα2 (75 ng ml−1) and 2.5 μM inhibitor (JMS-175-2, FX-171-C or FX-171-A), 2.5 μM negative control (AP-5-145) or DMSO control (0.1%) for 4 h. Expression of indicated IFN-induced genes (ISG15 (b), IFIT1 (c), IFIT2 (d), IFITM1 (e) and CXCL10 (f)) normalized to RNA18S is presented as the fold change to a control treated with IFN + DMSO. Data points are from four independent experiments. g, MCF10A cells (BRCC45 WT and BRCC45 R137A) were treated with or without hIFNα1 (50 ng ml−1) and 5 μM inhibitor (JMS-175-2, FX-171-C or FX-171-A), 5 μM negative control (AP-5-145) or DMSO control (0.1%) for 90 min. IFNAR1 cell surface levels (%) were quantified using FACS analysis and calculated as a percentage of no IFN stimulation. Data points are from three independent experiments. h, THP-1 cells were treated with or without hIFNα2 (25 ng ml−1) and 4 μM inhibitor (JMS-175-2, FX-171-C or FX-171-A), 4 μM negative control (AP-5-145), DMSO control (0.1%) or JAK–STAT inhibitor tofacitinib (0.4 μM) for 16 h. IFNAR1 surface levels were quantified using FACS analysis and the median fluorescence intensity of allophycocyanine (APC)–IFNAR1 was calculated as a percentage of no IFN stimulation. Data points are from three independent experiments. Statistical analyses in a were performed using paired, two-tailed t-tests to compare compound-treated cells to DMSO control cells. In bg, a one-way ANOVA with Dunnett’s multiple-comparisons test was used to compare statistical significance between AP-5-145 and BLUE compound treatment. In h, unpaired, two-tailed t-tests were used to compare compound-treated cells to DMSO control cells. Error bars represent ±s.e.m. Source data
Fig. 6
Fig. 6. BLUE compounds reduce ISG expression in PBMCs.
a,b, Type I IFN signaling gene expression analysis (67 genes normalized for housekeeping genes: ACTB, GAPDH, HPRT1 and RPLP0) of healthy control PBMCs stimulated with IFNα2. Volcano plot of genes increased upon addition of IFNα2 with negative control AP-5-145 compared to DMSO (no IFN) condition (a). Effect of JMS-175-2 + IFN stimulation compared to AP-5-145 + IFN (b). The blue line indicates a P value of 0.05. Data points are the means from three independent experiments. c, CXCL10 protein levels in supernatant from IFNα2-stimulated healthy PBMCs (n = 3) quantified by ELISA and shown as a percentage of a control treated with IFN + DMSO (100%). The bar graph shows the average of three independent experiments. d, PBMCs were isolated from participants with SSc and treated with DMSO, AP-5-145, FX-171-C or JMS-175-2 for 16 h without IFN stimulation. Secreted CXCL10 in supernatant is shown as a percentage of the DMSO control. The bar graph shows the average of data from seven SSc donors. e, Type I IFN signaling gene expression analysis of unstimulated SSc PBMCs, treated with 2 µM AP-5-145, JMS-175-2 or FX-171-C. Heat map showing log2 mean fold change in ISG expression by treatment, compared to AP-5-145, according to qPCR SuperArray. ΔCt was calculated against the geometric mean of four housekeeping genes, followed by the ΔΔCt (fold change) relative to AP-5-145 and log2 transformation. Heat maps represent the mean fold change from nine SSc donors. P values were calculated using a Student’s t-test (two-tailed distribution and equal variances between the two samples). In ad, paired, two-tailed Student’s t-tests were used to compare between treatment conditions for statistical significance. Error bars represent ±s.e.m. Source data
Fig. 7
Fig. 7. Proposed model of BLUE compound mode of action.
Interferon binding to IFNAR1 receptors triggers JAK–STAT signaling and an elevated immune response. IFN also initiates IFNAR1 receptor ubiquitylation (K63-linked), receptor internalization and lysosomal degradation. The BRISC–SHMT2 complex is required for deubiquitylation of IFNAR1. BRISC is recruited to IFNAR1 and IFNAR2 through interactions with SHMT2 to promote sustained IFN signaling and inflammation. BLUE compounds (blue stars) promote the formation of a BRISC dimer complex, which sterically hinders SHMT2 and polyubiquitin binding. Some graphics in this image were generated with BioRender.com.
Extended Data Fig. 1
Extended Data Fig. 1. Validation of hit compounds.
a, Dose response curves for hit compounds against BRISC (1 nM), USP2 (100 nM) and trypsin (125 nM) using the internally-quenched fluorescence di-ubiquitin assay described in Fig. 1a. Data points from two independent experiments are plotted. b, Re-testing of purchased H20 hit compound presumed to be AT7519. Data points are mean ± SEM from three independent experiments. c, UV-vis profile of compound in well H20 and purchased AT7519 compounds from Synkinase and Selleckchem. d, Liquid-chromatography mass spectrometry (LC-MS) spectra of H20 compound. Inset, AT7519 structure. The difference between the H20 compound and AT7519 is 173 Da, which corresponds to the mass of a dichlorobenzoyl group. e, MS fragmentation analyses for H20 compound and a synthesised isomer, AP-5-144. f, Profiling JMS-175-2 activity (5 µM) against a panel of 48 available DUBs using a ubiquitin-rhodamine(110)-glycine enzymatic assay. Data points are from two independent experiments. Source data
Extended Data Fig. 2
Extended Data Fig. 2. Identification of a higher-order BRISC conformation.
a, 32-point dose-response inhibition assay with JMS-175-2 and FX-171-C, with a biphasic curve fitted. Data points are mean ± SEM of two independent experiments carried out in technical duplicate. b, Michaelis-Menten plots of BRISC activity against a K63-linked di-ubiquitin fluorogenic substrate with increasing concentrations of JMS-175-2 and FX-171-C. Data points are mean ± SEM of three independent experiments carried out in technical duplicate. c, In-gel DUB assay comparing cleavage of a TAMRA-labelled K63-linked tetraubiquitin substrate by BRISC (left) and ARISC (right) with indicated compounds. Uncropped gels are in Source Data Extended Fig. 2. The gels shown are representative of three independent experiments. d, Representative micrograph from 14,296 movies (BRISC dataset) and corresponding 2D class averages generated in cryoSPARC. e, f, Cryo-EM processing workflow for BRISC f, monomer and g, dimer. Green indicates selected classes for 3D refinement in cryoSPARC. f, Final monomer cryo-EM density map coloured by local resolution and Euler angular distribution (left). Rod heights are proportional to the number of particles in each direction. Unmasked FSC curves with resolution calculated using the gold standard FSC cut-off at 0.143 and 0.5 frequency. g, Final dimer maps with C1 and C2 symmetry applied, coloured by local resolution. Euler angular distribution shown with rods, and unmasked FSC curves, as in f. h, Top, surface model of ARISC dimers observed in negative stain EM from grids prepared using the GraFix cross-linking method. The same conformation is reported for BRISC dimers from nsEM grids prepared using GraFix. Bottom, an asymmetric BRISC dimer conformation observed in cryo-EM without cross-linking. Source data
Extended Data Fig. 3
Extended Data Fig. 3. Identification of BRISC dimers in mass photometry and native mass spectrometry.
a, Native mass spectra of BRISC mixed with DMSO (control), JMS-175-2, or FX-171-C. BRISC complexes and subcomplexes are highlighted. b, Table of calculated masses for different BRISC subcomplexes and super complexes. c, Mass photometry measurements of BRISC dimer at increasing inhibitor concentrations. Counts corresponding to BRISC dimer as a fraction of total counts are plotted. Data points are mean ± SEM from three independent experiments. d, Left, K63-linked diUb (dark grey) modelled on the MPN+ domain of BRCC36 in BRISC (light grey), based on the AMSH LP-diUb structure (PDB: 2ZNV). Right, Upon dimer formation, the second BRISC monomer sterically clashes with the proximal ubiquitin when it is bound to either BRCC36 active site. Source data
Extended Data Fig. 4
Extended Data Fig. 4. Cryo-EM processing of the BRISC-inhibitor co-complex.
Figures ac correspond to the BRISC-FX-171-C cryo-EM dataset. Figures df correspond to the BRISC-JMS-175-2 dataset. a, d, Representative micrographs (from 16,750 (FX-171-C) and 7,771 movies (JMS-175-2)) and 2D class averages. b, e, Image processing workflow. Green maps indicate selected classes used for 3D refinement. c, f, Left, cryo-EM density maps after 3D refinement for the final reconstructions used for model building. Asterisks indicate BLUE compound binding sites. Right, final maps with corresponding Euler angular distribution with rod heights proportional to the number of particles in each direction. FSC curves with resolution calculated using the gold standard FSC cut-off at 0.143 frequency. g, Mask used for focused refinement of the BRISC-FX-171-C map. h, Chemical structure of FX-171-C fitted into EM density before (left) and after (right) focused refinement. Cryo-EM density visualised using the surface zone tool in ChimeraX; left, radius 2.04, right, radius 2.60. i, Mask applied during refinement of BRISC-JMS-175-2 map. j, Chemical structure of JMS-175-2 fitted into EM density before (left) and after (right) focused refinement. Cryo-EM density visualised using the surface zone tool in ChimeraX; left, radius 2.20, right, radius 2.41. k, Overlay of two BRISC dimers aligned on one BRISC molecule (grey) for comparison. Models are represented as surfaces. Orange, model fitted to the BRISC-FX-171-C structure shown in c, yellow, BRISC models rigid-body fitted in the cryo-EM density of the asymmetric dimer shown in Extended Data Fig. 2g. The yellow molecule is shifted relative to the orange molecule. l, Models described in k, focussed on the small molecule binding site highlighting the shift in the BRCC45’ α6 and α10 helices.
Extended Data Fig. 5
Extended Data Fig. 5. Observed changes in BRISC subunit solvent accessibility and secondary structure in the presence of FX-171-C by HDX-MS.
a, Wood’s plots generated with Deuteros showing the differences in deuterium uptake over all four HDX timepoints from three technical replicates, comparing BRISC in the absence and presence of FX-171-C. Regions highlighted in grey indicate peptides with no significant change, calculated using a 99% confidence interval, between the two conditions. The dashed line indicates the 99% confidence limit. Peptides are coloured in red to indicate deprotection in the presence of inhibitor, and blue to indicate protection. b, Peptides mapped onto BRISC dimer structure, highlighting peptides near BLUE binding site and at the interface of two BRCC45 subunits. B36 = BRCC36; B45 = BRCC45. c, Example deuterium uptake curves in the absence and presence of FX-171-C. Data points are mean ± SEM from three technical replicates. d, BLUE compounds are allosteric inhibitors and do not disrupt the BRCC36 Zn2+ binding site. e, CSN5 active site in complex with inhibitor CSN5i-3 (PDB: 5J0G). f, Left, BRCC45 UEV-M bound to FX-171-C aligned to Ubc13 in complex with BAY 11-7082 (PDB: 4ONN) and NSC697923 (PDB: 4ONM). Right, BRCC45 UEV-M bound to FX-171-C aligned to Cdc34 in complex with CC0651 (PDB: 3RZ3).
Extended Data Fig. 6
Extended Data Fig. 6. BLUE compounds are allosteric inhibitors and selective for human BRISC.
a, Chemical structure of JMS-175-2 and analogues FX-25-1, FX-25-2, which have substitutions in the piperidine ring (highlighted in green). b, Dose-response inhibition of BRISC by indicated compounds. IC50 values: JMS-175-2 = 3.8 µM, FX-25-1 = 5.2 µM, FX-25-2 = 21 µM. Data points are mean ± SEM of three independent experiments carried out in technical duplicate. c, Multiple sequence alignment (black = conserved, white = not conserved) of Abraxas1 and Abraxas2 from indicated species. Coloured boxes indicate BLUE interacting residues. d, FX-171-C inhibition of different BRISC orthologues. Hs - H. sapiens, Mm - M. musculus, Dr - D. rerio, Cf - C. floridanus. Data points are mean ± SEM of three independent experiments carried out in technical duplicate. e, f, Multiple sequence alignment of e, BRCC36 and f, BRCC45 from indicated BRISC orthologues. Residues are coloured as in c. g, Mass photometry analyses of dimer formation with FX-171-C for HsBRISCΔNΔC and HsBRISCΔLoop. Fraction of counts corresponding to BRISC dimer are plotted. Data points are mean ± SEM of three independent experiments. h, Negative stain EM 2D class averages of HsBRISCΔLoop incubated with FX-171-C. 22% of particles in the 2D class averages correspond to BRISC dimers. i, BRISC-FX-171-C cryo-EM density map highlighting an extended loop in BRCC36 (dust cleaning size 7.1, map threshold 0.0044). Source data
Extended Data Fig. 7
Extended Data Fig. 7. Determining the DUB activity, inhibitor sensitivity, and SHMT2 inhibition of structure-guided mutants.
a, SDS-PAGE analysis of purified BRISC mutants. Each purified protein sample was generated from one purification. Uncropped gels are in Source Data Extended Fig. 7. b, Activity of BRISC mutants against an IQF di-ubiquitin substrate. Data points are mean ± SEM of three independent experiments carried out in technical duplicate. c, FX-171-C IC50 values from inhibition assays shown in Fig. 4. d, Protected and deprotected peptides from HDX-MS mapped onto the FX-171-C binding site. Peptides are coloured blue to indicate protection and red to indicate deprotection, after incubation with FX-171-C. e, Superimposition of the SHMT2 dimer from BRISC-SHMT2 structure (PDB: 6R8F) onto BRISC-FX-171-C dimer structure. SHMT2 α6 helix clashes with the BLUE binding site. f, Mutated residues in BRCC45 are not in close proximity to the SHMT2 binding site in the BRISC-SHMT2 structure (PDB: 6R8F). g, Spectral Shift (Dianthus) assays measure the binding of SHMT2(A285T) to labelled His-BRISC in the absence and presence of compounds. KD is calculated by plotting the ratio of the fluorescence intensities at 650 nm and 670 nm against SHMT2 concentration, with a GraphPad Prism equation for one-site total binding. Data points are mean ± SEM of three independent experiments. Source data
Extended Data Fig. 8
Extended Data Fig. 8. Establishing the effect of BLUE compound treatment on immune signalling pathways, IFNAR1 surface levels, and IFNAR1 ubiquitylation.
a, Chemical structures of compounds AP-5-145, JMS-175-2, and FX-171-A. b, Dose-response inhibition of BRISC by indicated compounds. Data points are mean ± SEM from at least two independent experiments carried out in duplicate. c, Bar chart representing percentage of live cells across all conditions for ISRE expression and FACS analysis in THP-1 cells shown in Fig. 5a, h. THP-1 cells were treated with/without hIFNα2 (25 ng/mL) and either 4 μM inhibitor (JMS-175-2, FX-171-C, FX-171-A), 4 μM AP-5-145 negative control, DMSO control (0.1%), or JAK/STAT inhibitor Tofacitinib (*0.4 μM) for 16 h. Bars represent the means from three independent experiments. d, e, Luciferase analysis of the ISRE in THP-1 supernatant after stimulation with d, polyI:C (1 µg/mL), or e, ODN 2216 (1 µM) and treatment with either 4 μM inhibitor (JMS-175-2, FX-171-C, FX-171-A), 4 μM AP-5-145 negative control, or JAK/STAT inhibitor Tofacitinib (*0.4 μM) for 16 h. f, NF-κB pathway activity analysed by SEAP activity in THP-1 supernatants. Optical density measured at 625 nm. Data points in df are from three independent experiments. g, BRCC45 protein levels in selected clones after knock out in MCF10A Cas9 cells. sgROSA was used as a CRISPR Cas9 control. h, BRCC45 expression in whole cell lysates from MCF10A Cas9 cells expressing CRISPR control (sgROSA), BRCC45 WT, and BRCC45 R137A. i, Anti-Flag co-immunoprecipitation performed in indicated MCF10A cell lines. BRISC complex subunits were detected using specific antibodies. j, MCF10A cell lines were treated with and without hIFNα2 (75 ng/mL) for 1 h. STAT1 Tyr701 phosphorylation, BRCC45 and total protein levels (β-actin) were detected using specific antibodies. k, MCF10A Cas9 cells were treated with /without hIFNα2 for 4 h. Expression of interferon-induced genes ISG15, IFIT1, IFIT2, IFITM1, and CXCL10 were normalised to RNA18S and presented as fold change to own no IFN treated control. Data points are from three independent experiments. l, MCF10A cells (sgROSA, BRCC45 KO, BRCC45 WT and BRCC45 R137A) were treated with/without hIFN-Iα (50 ng/mL) for either 45 or 90 min. m, SgROSA MCF10A cells were treated with/without hIFN-Iα (50 ng/mL) and either 5 μM inhibitor (JMS-175-2, FX-171-C, FX-171-A), 5 μM negative control AP-5-145 or DMSO (0.1%) for 90 min. In l, m, IFNAR1 cell surface levels (%) were quantified using FACS analysis and calculated as a percentage of no IFN stimulation, and data points are from three independent experiments. n, Anti-IFNAR1 immunoblots of TUBE-pulldown. Left, input samples after stimulation with IFNα2, treatment with BLUE inhibitors and cell lysis. Right, ubiquitylated IFNAR1 isolated with agarose-TUBE beads after IFNα2 stimulation. The blot shown is representative of three biological replicates. Raw, uncropped Western blots are in Source Data Extended Fig. 8. o, Ponceau stained membrane of blots shown in n, prior to antibody incubation. p, Densitometry quantification of Western blot shown in n, and two other biological replicates (n = 3). In df, paired, two-tailed t-tests were used to compare compound treated cells with DMSO control cells. In k, a two-way ANOVA with Tukey’s multiple comparisons test was used to gene expression levels for five genes in both BRCC45 WT and BRCC45 R137A cells to the sgROSA MCF10A cells. In l, a two-way ANOVA with Tukey’s multiple comparisons test was performed to compare no IFN vs. IFN 45 min vs. IFN 90 min. Error bars represent ± SEM. In m, p, statistical analyses were performed using unpaired, two-tailed t-tests to compare compound treated cells with DMSO control cells. Source data
Extended Data Fig. 9
Extended Data Fig. 9. BLUE compounds reduce interferon-stimulated gene expression in stimulated healthy and unstimulated SSc PBMCs.
ac, Type I IFN signalling gene expression analysis of healthy control PBMCs treated with/without IFNα2 (20 ng/mL) and DMSO control (0.1 %) or 2 µM AP-5-145, JMS-175-2, or FX-171-C for 16 h (n = 3). a, Volcano plot illustrating genes increased with addition of IFN + DMSO vs. DMSO only. b, Volcano plot illustrating no change in gene expression with negative control AP-5-145 + IFN vs. DMSO + IFN only. In a, and b, data points are the means from three independent experiments. P values were calculated using a Student’s t-test (two-tailed distribution and equal variances between the two samples). c, Heatmap of each ISG expression levels relative to each donors housekeeping gene expression levels (geometric mean of ACTB, GAPDH, HPRT1, RPLP0), shown as Log2 fold change to grouped AP-5-145. Data shown for each individual donor, HC = healthy control. Heat map represents the mean fold change from three healthy donors. d, Type I IFN signalling gene expression analysis of unstimulated SSc PBMCs from nine patients, treated with 2 µM AP-5-145, JMS-175-2, or FX-171-C for 16 h. ISG relative expression to each donors housekeeping genes, shown as Log2 fold change relative to grouped AP-5-145, as in a. P refers to patient number that is P1 = patient 1. Heat map represents the mean fold change from nine SSc donors. e, PBMCs were isolated from patients and treated with DMSO (0.1%), 2 µM AP-5-145, FX-171-C or JMS-175-2 for 16 h without IFN stimulation. Composite ISG score (including CXCL10, IFIT1, ISG15 and MX1) gene expression analysis between conditions relative to each donor DMSO control. Error bars represent ± SEM. Individual data points represent the mean fold change for each gene for 20 donors. Statistical analysis was performed using a paired, two-tailed t-test. Source data

Update of

References

    1. Hershko, A. & Ciechanover, A. The ubiquitin system. Annu. Rev. Biochem.67, 425–479 (1998). - PubMed
    1. Komander, D., Clague, M. J. & Urbé, S. Breaking the chains: structure and function of the deubiquitinases. Nat. Rev. Mol. Cell Biol.10, 550–563 (2009). - PubMed
    1. Komander, D. & Rape, M. The ubiquitin code. Annu. Rev. Biochem.81, 203–229 (2012). - PubMed
    1. Walden, M., Masandi, S. K., Pawłowski, K. & Zeqiraj, E.Pseudo-DUBs as allosteric activators and molecular scaffolds of protein complexes. Biochem. Soc. Trans.46, 453–466 (2018). - PubMed
    1. Clague, M. J., Urbé, S. & Komander, D. Breaking the chains: deubiquitylating enzyme specificity begets function. Nat. Rev. Mol. Cell Biol.20, 338–352 (2019). - PubMed

MeSH terms

Substances

LinkOut - more resources