Comparative Study
. 2025 Mar 18;25(1):348.
doi: 10.1186/s12870-025-06372-6.

Comparative phenotypic, physiological, and transcriptomic responses to drought and recovery in two Fraxinus species

Affiliations
Comparative Study

Comparative phenotypic, physiological, and transcriptomic responses to drought and recovery in two Fraxinus species

Tae-Lim Kim et al. BMC Plant Biol. .

Abstract

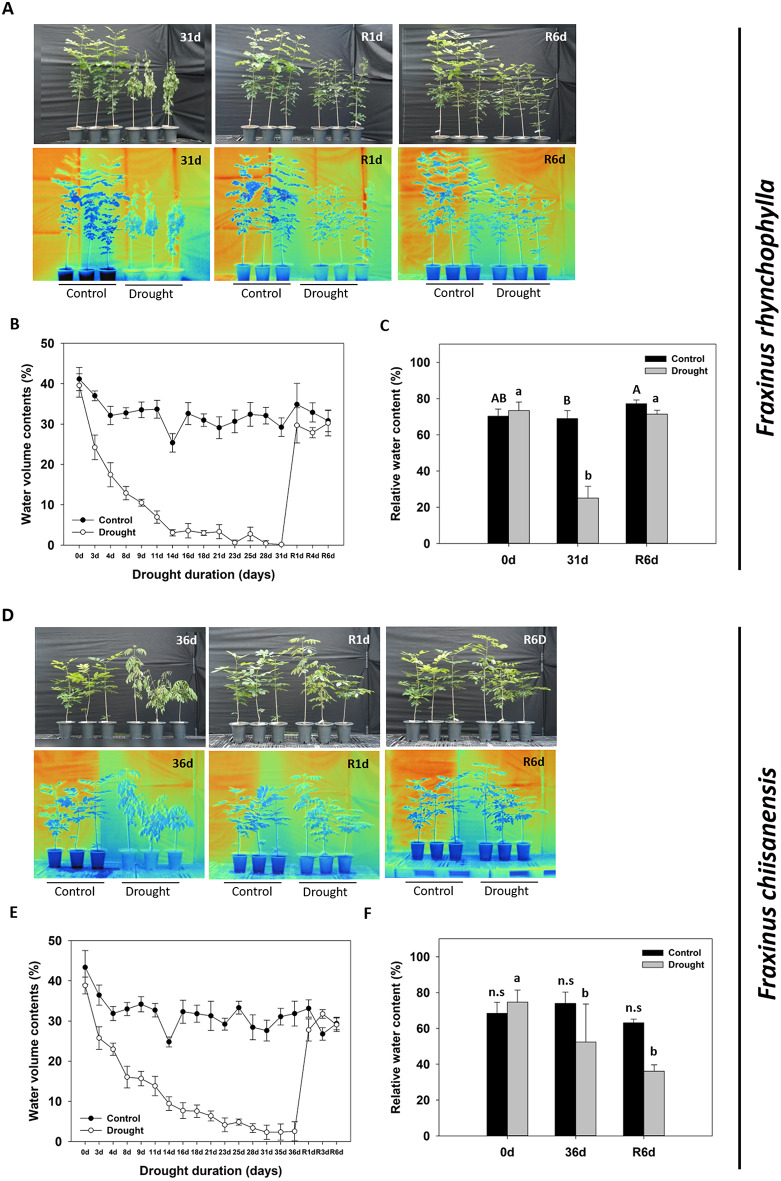
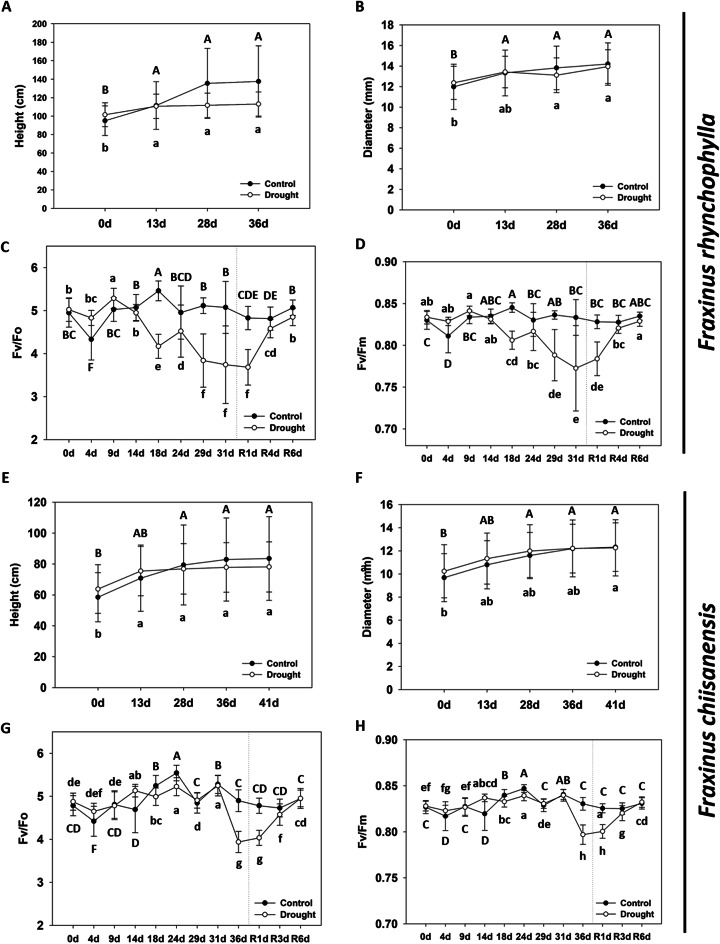
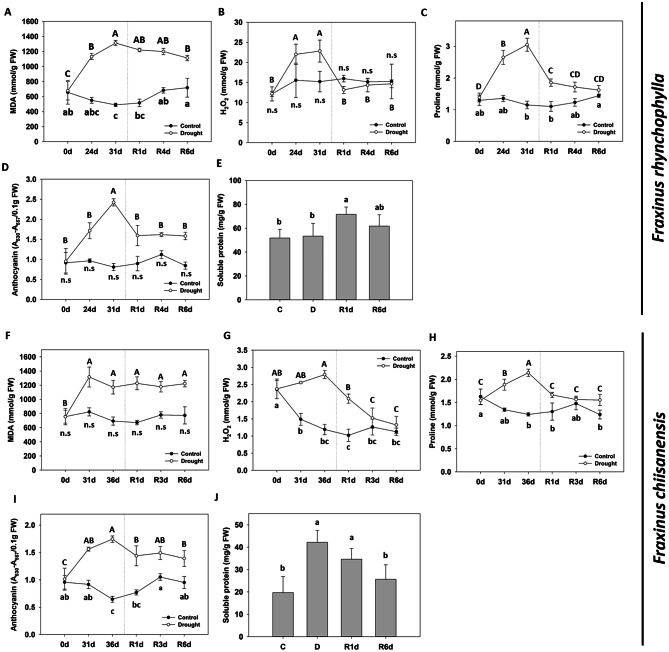
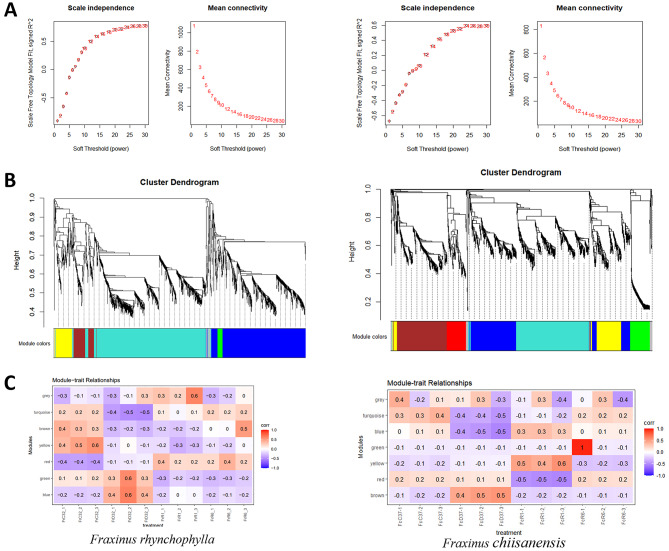
Background: This study focused on the drought tolerance and resilience of two ash species: Fraxinus chiisanensis and F. rhynchophylla. These two species are distributed in different habitats, suggesting that they have different levels of drought tolerance. Understanding their response to drought stress, particularly during the seedling stage, is crucial for selecting and developing drought-resistant varieties. This study aimed to compare the phenotypic, physiological, and transcriptomic characteristics of drought-stressed and recovered rewatered plants in a time-course experiment.

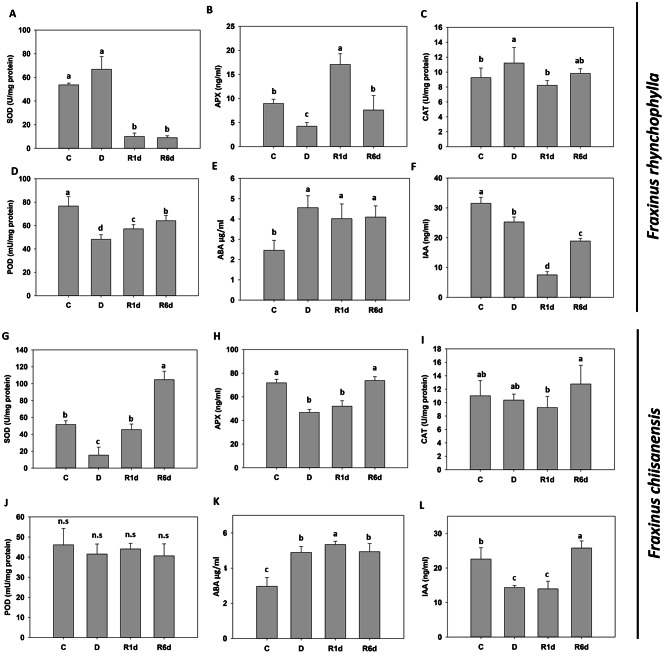
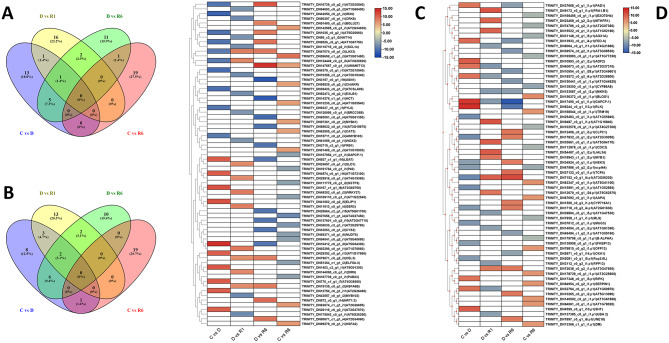
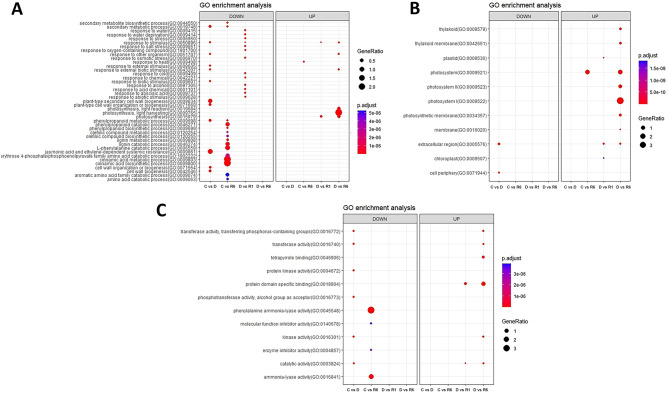
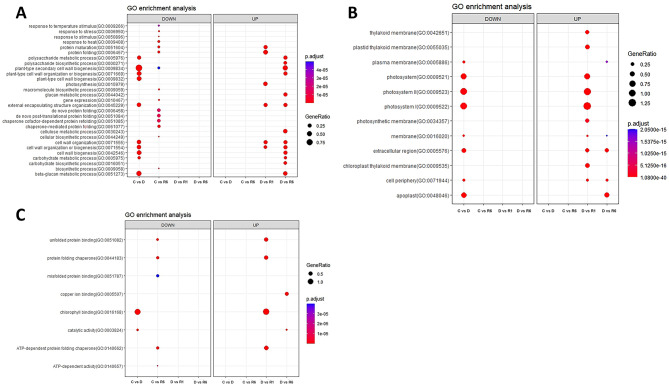
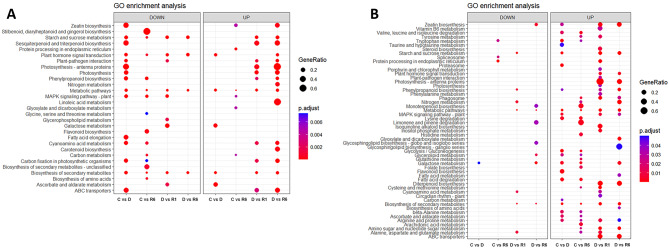
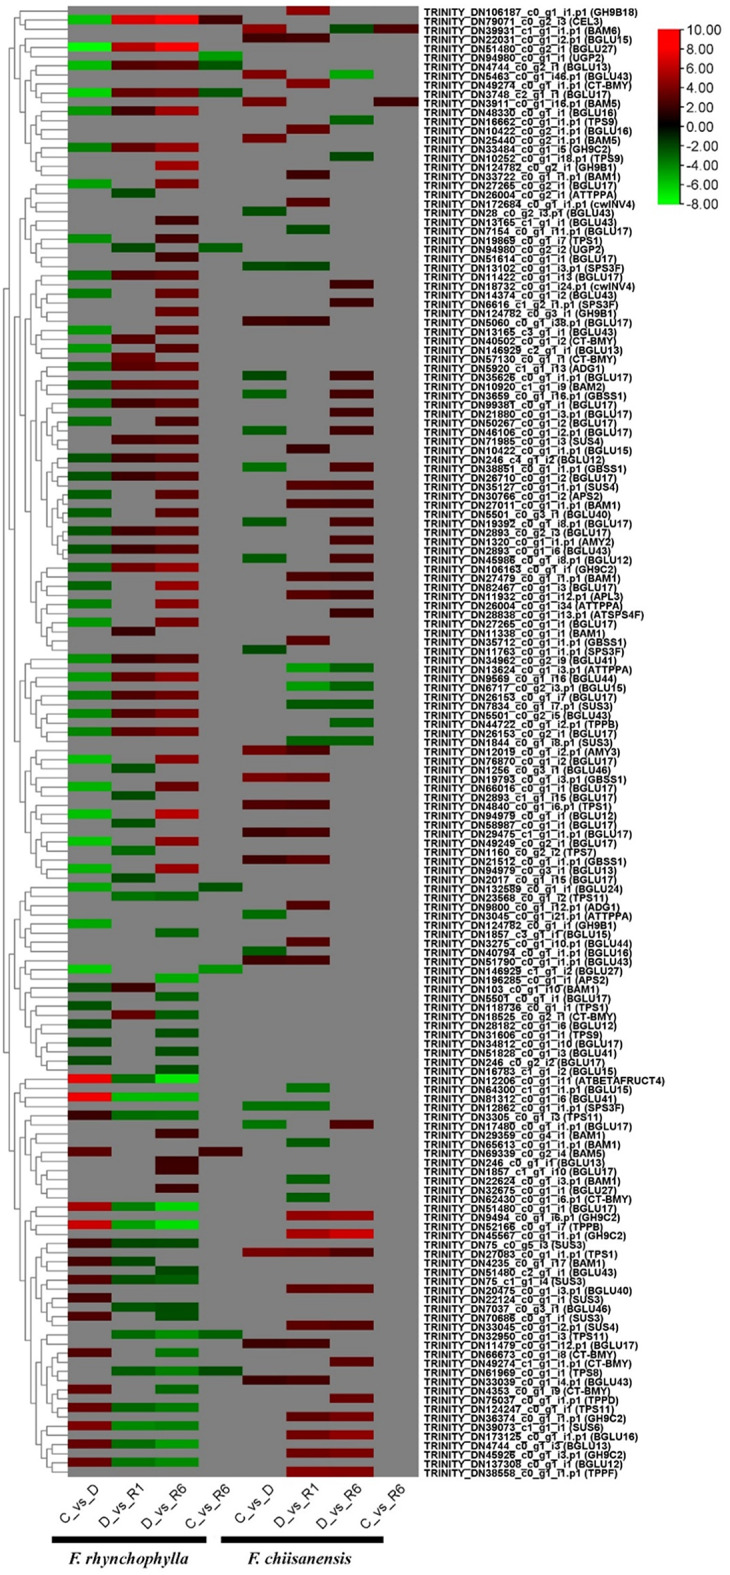
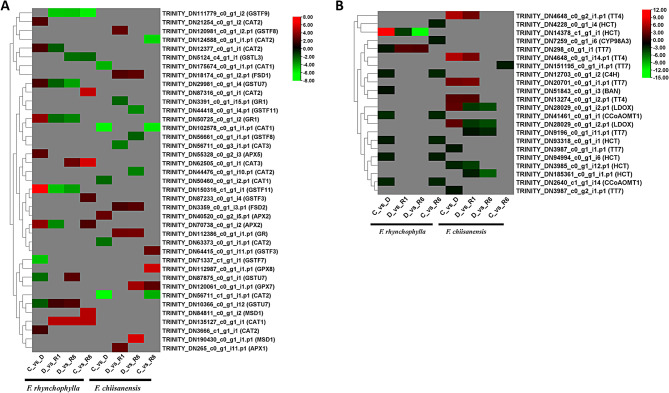
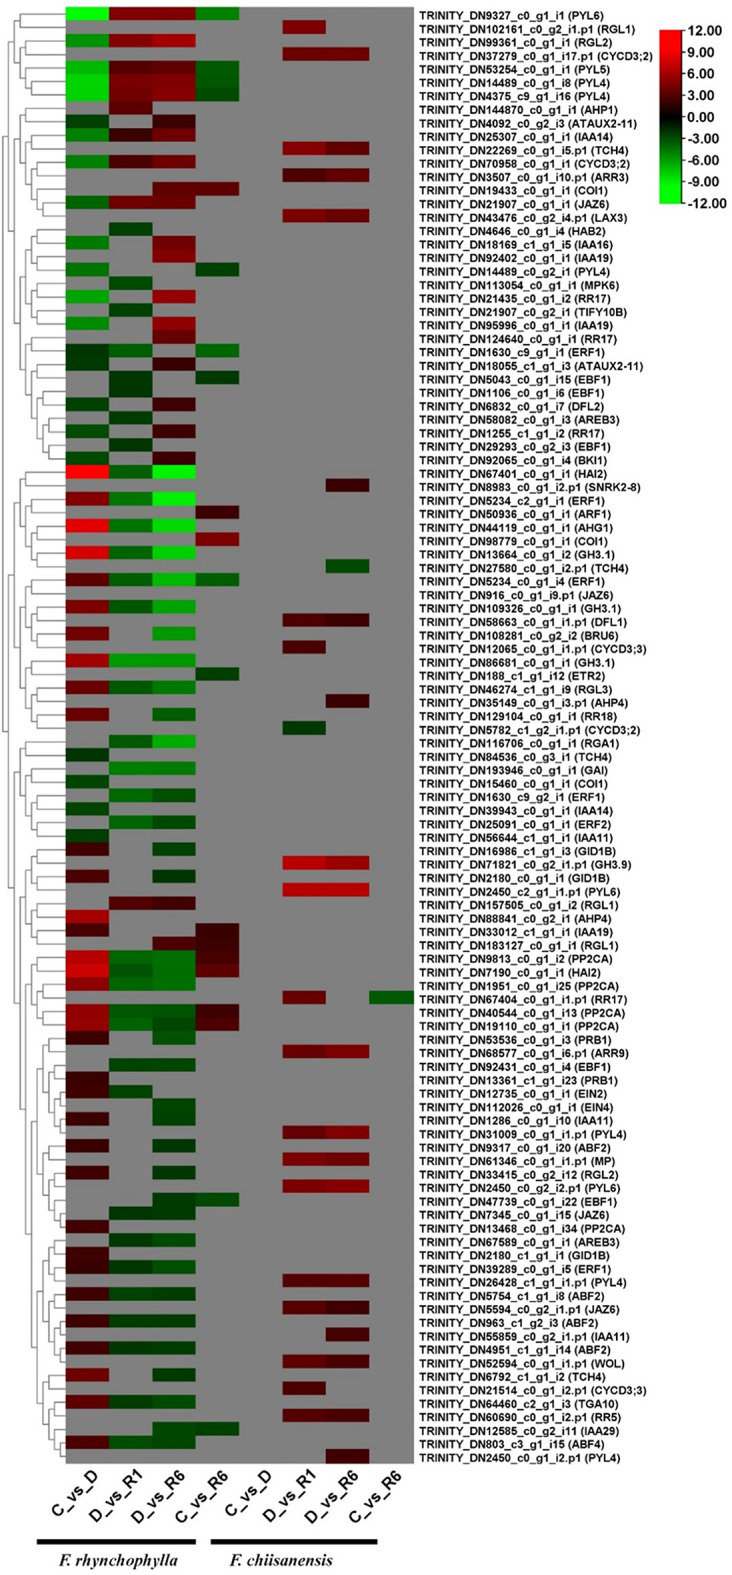
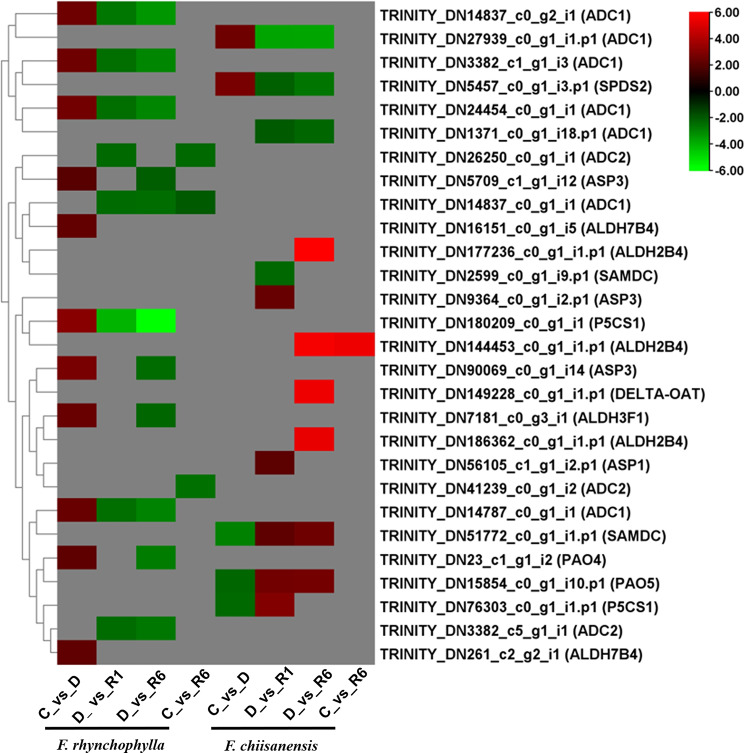
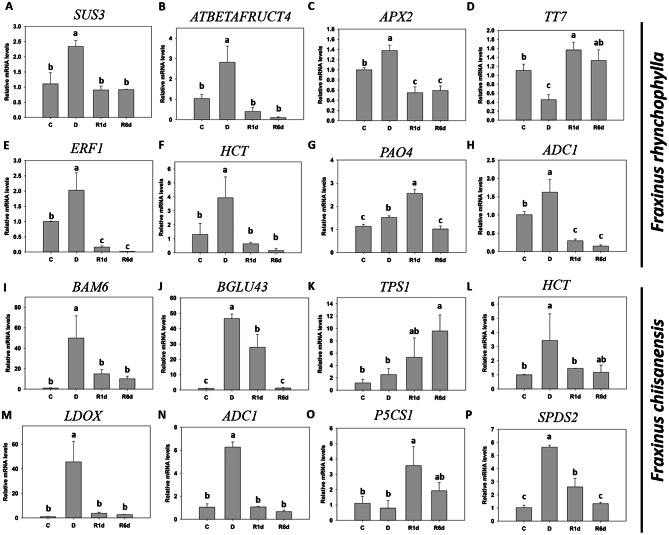
Results: In F. rhynchophylla, drought stress resulted in more severe growth retardation, temperature increase, and a faster decline in the fluorescence response, accompanied by a significant rise in stress indices. However, these reactions recovered quickly after rehydration. In contrast, F. chiisanensis exhibited less growth retardation, a slower decline in fluorescence, and milder increases in stress indices, although many individuals did not fully recover after rehydration. The activity of antioxidant enzymes (SOD, CAT, APX) was more responsive and recovered more efficiently in F. rhynchophylla, while F. chiisanensis had a weaker and delayed response. Transcriptome analysis revealed that photosynthesis and enzyme activity were the most responsive to drought and recovery, as shown by Gene Ontology term analysis. Kyoto Encyclopedia of Genes and Genomes pathway analysis identified common pathways involved in starch and sucrose metabolism and phenylpropanoid biosynthesis in both species. F. rhynchophylla had more differentially expressed genes (DEGs) than F. chiisanensis, particularly on the drought and recovery day 6. Most drought-induced DEGs were restored after rehydration. Commonly associated genes included BGLU and TPS in sugar metabolism; CAT, GSTF, TT7, and HCT in antioxidant enzymes; PYL4 and RR17 in hormone signaling; and ADC1 and ASP3 in proline synthesis.

Conclusions: This study highlights the species-specific characteristics of drought and recovery responses of two Fraxinus species and provides targets for assessing and improving drought tolerance. Moreover, the results of this study provide insights into the physiological and genetic responses of Fraxinus and may guide future research on ash tree stress tolerance.

Keywords: Drought stress5; Fraxinus chiisanensis1; Fraxinus rhynchophylla2; Physiological response4; transcriptome3.


Conflict of interest statement

Declarations. Ethics approval and consent to participate: All the methods involving plants, and their materials complied with relevant institutional, local and national regulations. All plant materials are permitted. Consent for publication: Not applicable. Competing interests: The authors declare no competing interests.

Figures

Fig. 1
Fig. 1
Representative phenotypes of F. rhynchophylla and F. chiisanensis. (A, D) Recovery of drought-stressed and control group seedlings after water resupply (upper) and infrared thermal images (bottom). (B, E) Volumetric water content of the soil in pots containing drought-treated plants. (C, F) Relative water content (RWC) of the leaves. The values are the means ± SD (n = 10). Different uppercase letters and lowercase letters indicate significant differences (control: uppercase letters; drought: lowercase letters; ANOVA with Tukey’s honestly significant difference test, p < 0.05)
Fig. 2
Fig. 2
Growth phenotype and physiological changes in F. rhynchophylla and F. chiisanensis. (A, E) Effect of drought treatment and re-watering on shoot growth. (B, F) Effect of drought treatment and re-watering on plant diameter. (C, G) The Fv/Fo ratio. (D, H) The Fv/Fm ratio. The values are the means ± SD (n = 10). Different uppercase and lowercase letters indicate significant differences (control: uppercase letters; drought: lowercase letters; ANOVA with Tukey’s honestly significant difference test, p < 0.05)
Fig. 3
Fig. 3
Effect of drought stress and re-watering on drought stress indicators in F. rhynchophylla and F. chiisanensis. (A, F) Malondialdehyde (MDA) content. (B, G) H2O2 content. (C, H) Proline content. (D, I) Anthocyanin content. (E, J) Soluble protein content. Different uppercase letters and lowercase letters indicate significant differences (control: uppercase letters; drought: lowercase letters; ANOVA with Tukey’s honestly significant difference test, p < 0.05)
Fig. 4
Fig. 4
Effect of drought stress and re-watering on drought stress hormones and antioxidants in F. rhynchophylla and F. chiisanensis. (A, G) Superoxide dismutase (SOD) activity. (B, H) Ascorbate peroxidase (APX) activity. (C, I) Catalase (CAT) activity. (D, J) Peroxidase (POD) activity. (E), (K) Abscisic acid (ABA) content. (F), (L) Indole-3-acetic acid (IAA) content. Different lowercase letters indicate significant differences (ANOVA with Tukey’s honestly significant difference test, p < 0.05)
Fig. 5
Fig. 5
Identification of differentially expressed genes (DEGs) between F. rhynchophylla and F. chiisanensis induced in response to drought and re-watering. The Venn diagram displays (A) the number of DEGs across the comparisons C vs. D, D vs. R1, D vs. R6, and C vs. R6 in F. rhynchophylla; (B) the number of DEGs across the comparisons C vs. D, D vs. R1, D vs. R6, and C vs. R6 in F. chiisanensis. (C) Heatmap showing the top 10 DEGs in the comparison groups C vs. D, D vs. R1, D vs. R6, and C vs. R6 in F. rhynchophylla. (D) Heatmap showing the top 10 DEGs in the comparison groups C vs. D, D vs. R1, D vs. R6, and C vs. R6 in F. chiisanensis
Fig. 6
Fig. 6
Dot plots illustrating the 10 most significant Gene Ontology (GO) terms identified in the GO enrichment analysis. (A) Dot plot representing the top 10 GO terms for the biological process category. (B) Dot plot depicting the top 10 GO terms for the cellular component category. (C) Dot plot showing the top 10 GO terms in F. rhynchophylla for the molecular function category
Fig. 7
Fig. 7
Dot plots illustrating the 10 most significant Gene Ontology (GO) terms identified in the GO enrichment analysis. (A) Dot plot representing the top 10 GO terms for the biological process category. (B) Dot plot depicting the top 10 GO terms for the cellular component category. (C) Dot plot showing the top 10 GO terms in F. chiisanensis for the molecular function category
Fig. 8
Fig. 8
Dot plots illustrating the 10 most significant KEGG terms identified in the enrichment analysis. (A) Dot plot representing the top 10 KEGG terms across different comparison groups of F. rhynchophylla. (B) The dot plot representing the top 10 KEGG terms across different comparison groups of F. chiisanensis
Fig. 9
Fig. 9
Heatmap representing the expression levels of KEGG pathways, highlighting the expression levels of certain genes involved in starch and sucrose metabolism. The color scale in the upper right corner ranges from the lowest RPKM value indicated in green to the highest RPKM value shown in red
Fig. 10
Fig. 10
Heatmap representing the expression levels of KEGG pathways, highlighting the expression levels of certain genes involved in (A) enzymatic and (B) non-enzymatic antioxidant activity. The color scale in the upper right corner ranges from the lowest RPKM value indicated in green to the highest RPKM value shown in red
Fig. 11
Fig. 11
Heatmap representing the expression levels of KEGG pathways, highlighting the expression levels of certain genes involved in plant hormone signaling. The color scale in the upper right corner ranges from the lowest RPKM value indicated in green to the highest RPKM value shown in red
Fig. 12
Fig. 12
Heatmap representing the expression levels of KEGG pathways, highlighting the expression levels of certain genes involved in proline signaling. The color scale in the upper right corner ranges from the lowest RPKM value indicated in green to the highest RPKM value shown in red
Fig. 13
Fig. 13
Analysis of module-trait correlations and the WGCNA co-expression network generated. (A) The summary of network indices (Y-axis) is plotted against the soft-thresholding power (X-axis). The values indicated in the plot correspond to the respective soft-thresholding powers. (B) The co-expression modules were identified through the Dynamic Tree Cut method of the hierarchical clustering tree. Each leaf, represented by a small vertical line, corresponds to a gene. The branches of the dendrogram are color-coded to reflect the degree of relatedness among genes, facilitating the formation of modules. Genes that demonstrate high co-expression levels (correlation > 0.5) were aggregated into a single module, resulting in a total of four distinct modules. (C) Correlation between WGCNA modules and physiological traits. Each row corresponds to a module, while the columns represent drought-related characteristics. The color of each cell indicates the correlation coefficient between the traits and the respective module. A positive correlation is denoted in red, whereas a negative correlation is indicated in blue. The correlation coefficient is displayed as the top number in each cell, with the P-value presented in parentheses below
Fig. 14
Fig. 14
Validation of the differential expression of 16 genes using qPCR. (A-H) qPCR results for F. rhynchophylla genes and (I-P) F. chiisanensis. (A) sucrose synthase 3 (SUS3). (B) Glycosyl hydrolases family 32 protein (ATBETAFRUCT4). (C) ascorbate peroxidase 2 (APX2). (D) Cytochrome P450 superfamily protein (TT7). (E) ethylene responsive factor (ERF1). (F) hydroxycinnamoyl transferase (HCT). (G) polyamine oxidase 4 (PAO4). (H) arginine decarboxylase 1 (ADC1). (I) beta-amylase 6 (BAM6). (J) beta glucosidase (BGLU43). (K) trehalose-6-phosphate synthase (TPS1). (L) hydroxycinnamoyl-CoA shikimate/quinate hydroxycinnamoyl transferase (HCT). (M) leucoanthocyanidin dioxygenase (LDOX). (N) arginine decarboxylase 1 (ADC1). (O) delta1-pyrroline-5-carboxylate synthase 1 (P5CS1). (P) spermidine synthase 2 (SPDS2). Different lowercase letters indicate significant differences (ANOVA with Tukey’s honestly significant difference test, p < 0.05)

Similar articles

References

    1. Bonan GB. Forests and climate change: forcings, feedbacks, and the climate benefits of forests. Science. 2008;320(5882):1444–9. - PubMed
    1. Friedlingstein P, Cox P, Betts R, Bopp L, von Bloh W, Brovkin V, et al. Climate–carbon cycle feedback analysis: results from the C4MIP model intercomparison. J Clim. 2006;19(14):3337–53.
    1. Kennedy D, Swenson S, Oleson KW, Lawrence DM, Fisher R, Lola da Costa AC, et al. Implementing plant hydraulics in the community land model, version 5. J Adv Model Earth Syst. 2019;11(2):485–513.
    1. Trenberth KE, Dai A, Rasmussen RM, Parsons DB. The changing character of precipitation. Bull Amer Meteorol Soc. 2003;84(9):1205–18.
    1. Dai A, Zhao T, Chen J. Climate change and drought. A precipitation and evaporation perspective. Curr Clim Change Rep. 2018;4:301–12.

Publication types

LinkOut - more resources