. 2025 Mar 3:16:1526815.
doi: 10.3389/fpls.2025.1526815. eCollection 2025.

Molecular characterization of homogentisate phytyltransferase and methylphytylbenzoquinol methyltransferase genes from olive fruit with regard to the tocopherol content and the response to abiotic stresses

Affiliations

Molecular characterization of homogentisate phytyltransferase and methylphytylbenzoquinol methyltransferase genes from olive fruit with regard to the tocopherol content and the response to abiotic stresses

Isabel Narváez et al. Front Plant Sci. .

Abstract

Two cDNA sequences, named OepHPT and OepMPBQ MT, encoding homogentisate phytyltransferase (HPT) and methylphytylbenzoquinol methyltransferase (MPBQ MT), respectively, have been cloned from olive (Olea europaea cv. Picual). Sequence analysis displayed the distinguishing characteristics typical of the HPT and MPBQ MT families and along with phylogenetic analysis indicated that they code for homogentisate phytyltransferase and methylphytylbenzoquinol methyltransferase enzymes, respectively. Transcriptional analysis in distinct olive tissues indicated that expression levels of HPT and MPBQ MT genes are spatially and temporally regulated in a cultivar-dependent manner and together with tocopherol analysis pointed out that both genes participate in the biosynthesis of the tocopherols present in olive mesocarp. These data also suggest that in olive mesocarp, HPT but not MPBQ MT could be implicated in the transcriptional regulation of the tocopherol biosynthetic pathway. In addition, HPT and MPBQ MT transcript levels are regulated by water status, temperature, light, and wounding in the olive fruit mesocarp, suggesting that both genes could be implicated in the abiotic stress response. Overall, this research constitutes a significant advance to elucidate the factors that regulate the tocopherol biosynthesis in olive fruit to obtain virgin olive oils with enhanced α-tocopherol content.

Keywords: HPT; MPBQ MT; Olea europaea; abiotic stresses; gene expression; olive; vitamin E.


Conflict of interest statement

The authors declare that the research was conducted in the absence of any commercial or financial relationships that could be construed as a potential conflict of interest. The author(s) declared that they were an editorial board member of Frontiers, at the time of submission. This had no impact on the peer review process and the final decision

Figures
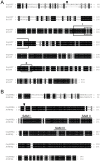
Figure 1
Figure 1
Comparison of the deduced amino acid sequences of olive HPT (A) and MPBQ MT (B) genes, with those from Arabidopsis. The sequences were aligned using the ClustalX program and displayed with GeneDoc. Identical and similar residues are shown on a background of black and grey, respectively. The putative cleavage sites of the chloroplast transit peptides are indicated by triangles. In the case of HPT, the prenyl-DP binding motif I and the divalent cation binding domain, both typical for polyprenyltransferases, are boxed with solid and dashed lines, respectively, and the Asp-rich motif II, which is involved in substrate binding is framed with a solid line. Regarding MPBQ MT, the three conserved domains SAM I, II, and III characteristics of S-adenosylmethionine-dependent methyltransferases are denoted by continuous lines. The cDNA sequences corresponding to OepHPT and OepMPBQ MT have been deposited in the GenBank/EMBL/DDBJ database with accession numbers PQ479102 and PQ479103, respectively. The accession numbers of AtHPT and AtMPBQ MT are AF324344 and CAB87794, respectively.
Figure 2
Figure 2
Phylogenetic tree analysis of plant homogentisate phytyltransferases (A) and methylphytylbenzoquinol methyltransferases (B). Alignments were calculated with ClustalX and the analysis was performed using the neighbor-joining method implemented in the Phylip package using Kimura’s correction for multiple substitutions, and a 1000 bootstrap data set. TreeView was used to display the tree. Positions of the olive HPT and MPBQ MT are in bold and underlined. Accession numbers of the different HPT and MPBQ MT included in this analysis are indicated in Supplementary Table 2. .
Figure 3
Figure 3
Relative expression levels of olive HPT and MPBQ MT genes in different organs and tissues of Picual and Arbequina cultivars. The relative expression levels were determined by qRT-PCR in the indicated organs and tissues as described under section “Materials and Methods”. Data are presented as means ± SD of three biological replicates. *Indicates significantly different (P<0.05) to ‘Picual’ by two-way analysis of variance (ANOVA) with a Bonferroni posttest in ‘Arbequina’ tissues.
Figure 4
Figure 4
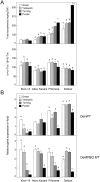
Total tocopherol content and (α+γ)-tocopherol/(β+δ)-tocopherol ratio (A), and relative expression levels of olive HPT and MPBQ MT genes (B) in the mesocarp tissue from Picual and Arbequina cultivars. The beginning of fruit ripening corresponding to the appearance of a pink-purple colour is denoted by an arrow. At the indicated stages, tocopherols were analyzed by HPLC, and the relative expression levels were determined by qRT-PCR as described under section “Materials and Methods”. Data are presented as means ± SD of three biological replicates. *Indicates significantly different (P<0.05) to ‘Picual’ by two-way ANOVA with a Bonferroni posttest in ‘Arbequina’.
Figure 5
Figure 5
Total tocopherol content and (α+γ)-tocopherol/(β+δ)-tocopherol ratio (A), and relative expression levels of olive HPT and MPBQ MT genes (B) in the mesocarp tissue from different olive cultivars. At the indicated stages, tocopherols were analyzed by HPLC, and the relative expression levels were determined by qRT-PCR as described under section “Materials and Methods”. Data are presented as means ± SD of three biological replicates. Different letters denote significant differences (P < 0.05) for each gene and cultivar by one-way ANOVA followed by Tukey’s post-test for multiple comparisons.
Figure 6
Figure 6
Effect of regulated deficit irrigation (RDI) treatments on the relative expression levels of olive HPT and MPBQ MT genes in the mesocarp tissue from cultivar Arbequina during olive fruit development and ripening. The relative expression levels were determined by qRT-PCR at the indicated stages of fruit development as described in “Materials and Methods”, using the expression level of the corresponding gene at 13 WAF from full irrigation (FI) treatment as calibrator. Data are presented as means ± SD of three biological replicates. *Indicates that 60 RDI is significantly different (P < 0.05) to FI by two-way ANOVA with a Bonferroni post-test. **Indicates that 30 RDI is significantly different (P < 0.05) to FI by two-way ANOVA with a Bonferroni post-test.
Figure 7
Figure 7
Effect of low (A) and high (B) temperature on the relative expression levels of olive HPT and MPBQ MT genes in the mesocarp tissue from Picual and Arbequina cultivars. Olive tree branches with about 100 olive fruits (28 WAF) were incubated using standard conditions except that the temperature was 15°C (A) or 35°C (B). At the indicated times, the relative expression levels were determined by qRT-PCR as described in “Materials and Methods”, using the expression level of the corresponding gene at zero time as a calibrator. Data are presented as means ± SD of three biological replicates. *Indicates significantly different (P<0.05) to time 0 h by two-way ANOVA with a Bonferroni posttest. Boxes in the upper part indicate light (open) or dark (closed) periods.
Figure 8
Figure 8
Effect of darkness (A) and wounding (B) on the relative expression levels of olive HPT and MPBQ MT genes in the mesocarp tissue from Picual and Arbequina cultivars. Olive tree branches with about 100 olive fruits (28 WAF) were incubated using standard conditions except that the olive fruit were incubated under darkness (A) or were mechanically damaged (B). At the indicated times, the relative expression levels were determined by qRT-PCR as described in “Materials and Methods”, using the expression level of the corresponding gene at zero time as a calibrator. Data are presented as means ± SD of three biological replicates. *Indicates significantly different (P<0.05) to time 0 h by two-way ANOVA with a Bonferroni posttest. Boxes in the upper part indicate light (open) or dark (closed) periods.

References

    1. Abdallah I. B., Tlili N., Martinez-Force E., Rubio A. G. P., Perez-Camino M. C., Albouchi A., et al. . (2015). Content of carotenoids, tocopherols, sterols, triterpenic and aliphatic alcohols, and volatile compounds in six walnuts (Juglans regia L.) varieties. Food Chem. 173, 972–978. doi: 10.1016/j.foodchem.2014.10.095 - DOI - PubMed
    1. Aparicio R., Harwood J. L. (2013). Handbook of olive oil: analysis and properties (New York, USA: Springer; ).
    1. Baccari S., Elloumi O., Chaari-Rkhis A., Fenollosa E., Morales M., Drira N., et al. . (2020). Linking leaf water potential, photosynthesis and chlorophyll loss with mechanisms of photo- and antioxidant protection in juvenile olive trees subjected to severe drought. Front. Plant Sci. 11. doi: 10.3389/fpls.2020.614144 - DOI - PMC - PubMed
    1. Beltrán G., Jiménez A., Del Río C., Sánchez S., Martínez L., Uceda M., et al. . (2010). Variability of vitamin E in virgin olive oil by agronomical and genetic factors. J. Food Comp. Anal. 23, 633–639. doi: 10.1016/j.jfca.2010.03.003 - DOI
    1. Brigelius-Flohe R., Traber M. G. (1999). Vitamin E: function and metabolism. FASEB J. 13, 1145–1155. doi: 10.1096/fasebj.13.10.1145 - DOI - PubMed

LinkOut - more resources