. 2025 Mar 17;9(3):e70098.
doi: 10.1002/hem3.70098. eCollection 2025 Mar.

Loss of CYLD promotes splenic marginal zone lymphoma

Affiliations

Loss of CYLD promotes splenic marginal zone lymphoma

Athanasios Pseftogas et al. Hemasphere. .

Abstract

Splenic marginal zone lymphoma (SMZL) is a distinct clinical and pathological entity among marginal zone lymphomas. Genetic and microenvironmental factors leading to aberrant activation of the NF-κB pathway have been implicated in SMZL pathogenesis. CYLD is a negative regulator of NF-κB and other signaling pathways acting as a deubiquitinase of regulatory molecules and has been reported as a tumor suppressor in different types of cancer, including B-cell malignancies. To assess whether CYLD is implicated in the natural history of SMZL, we profiled primary cells from patients with SMZL and SMZL cell lines for CYLD expression and functionality. We report that CYLD is downregulated in patients with SMZL and that CYLD ablation in vitro leads to NF-κB pathway hyperactivation, promoting the proliferation of SMZL cells. In addition, we found that CYLD deficiency was associated with increased migration of SMZL cells in vitro, through CCR7 receptor signaling, and with increased dissemination in vivo. CYLD loss was sufficient to induce BcR signaling, conferring increased resistance to ibrutinib treatment in vitro. In summary, our work uncovers a novel role of CYLD as a key regulator in SMZL pathogenesis, dissemination, and resistance to targeted agents. On these grounds, CYLD could be proposed as a novel target for patient stratification and personalized interventions.


Conflict of interest statement

Paolo Ghia: honoraria/advisory board: AbbVie, AstraZeneca, BeiGene, BMS, Galapagos, Janssen, Loxo/Lilly, MSD, Roche; research funding: AbbVie, AstraZeneca, BMS, Janssen; Kostas Stamatopoulos: honoraria/advisory board: AbbVie, AstraZeneca, Gilead, Janssen; research funding: AbbVie, Gilead, Janssen; José Ángel Martínez Climent: research funding: AstraZeneca, BMS‐Celgene, Janssen, Palleon, Roche‐Genentech; Davide Rossi: honoraria/research funding: AbbVie, AstraZeneca; Cellestia, Gilead, Janssen, Verastem, Roche; Lydia Scarfò: advisory board: AbbVie, AstraZeneca, Janssen.

Figures

Figure 1
Figure 1
Variable CYLD expression in SMZL patients and cell lines. (A) Violin plot of CYLD expression in tumor (n = 35) and normal (n = 9) samples from fresh spleen biopsies. (B) Relative survival rates (RS rates) are shown for the high CYLD and low CYLD subgroups. (C) Violin plot of CYLD expression in FFPE samples stratified by different microenvironmental classes. (D) RT‐qPCR analysis of CYLD mRNA expression in SMZL cell lines. Values are shown as the mean ± SEM of relative mRNA levels from at least three independent experiments. Data were normalized to CYLD expression of the SL‐15 cell line. Statistical analysis was performed by the Student's t‐test method (*p < 0.05). (E) Representative picture of immunoblot analysis of CYLD protein expression in whole cell extracts from the SMZL cell lines. For CYLD analysis, we used an antibody that recognized both the full‐length CYLD and a C‐terminal fragment of CYLD (CYLD‐Ct). B‐actin was used as a loading control. The picture is representative of three independent experiments.
Figure 2
Figure 2
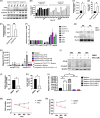
CYLD ablation induces NF‐κB pathway activation, proliferation, and cell cycle progression of the SL‐15 cell line. (A) Immunoblot analysis of CYLD protein expression in whole cell extracts from two control (CTL) and two CYLD KO (KO) clones of SL‐15 and SL‐22 cell lines. (B) Immunoblot analysis of p105‐p50 (canonical NF‐κB pathway) in whole cell extracts from two control (CTL) and two CYLD KO (KO) clones of SL‐15 and SL‐22 cell lines. The picture is representative of three independent experiments. (C) Quantification of p50/p105 ratio of immunoblot analysis presented in (B). Values are presented as the mean ± SEM of three independent experiments and statistical analysis was performed by Student's t‐test (*p < 0.05). (D) Immunoblot analysis of p100‐p52 (non‐canonical NF‐κB pathway) in whole cell extracts from two control (CTL) and two CYLD KO (KO) clones of the SL‐15 and SL‐22 cell lines. The picture is representative of three independent experiments. (E) Quantification of p52/p100 ratio of immunoblot analysis presented in (D). Values are presented as the mean ± SEM of three independent experiments, and statistical analysis was performed by Student's t‐test (*p < 0.05). (F) RT‐qPCR analysis of CD80, IL6, and ICAM1 mRNA in two control (CTL) and two CYLD KO (KO) clones of the SL‐15 cell line. Values are presented as the mean ± SEM of relative mRNA levels from at least three independent experiments. Data were normalized to the mRNA expression of the CTL D4 clone and statistical analysis was performed by Student's t‐test (*p < 0.05, **p < 0.01). (G), (H) Proliferation analysis by Trypan blue exclusion assay (G) and MTT assay (H) of two control (CTL) and two CYLD KO (KO) clones of the SL‐15 cell line, measured at 0, 24, 48, 72, and 96 h after seeding. Representative graph of three independent experiments, each performed in triplicate. Values are shown as the mean ± SEM, and statistical significance was assessed by the Student's t‐test (*p < 0.05, **p < 0.01). (I) Cell cycle analysis of two control (CTL) and two CYLD KO (KO) clones of the SL‐15 cell line, 4 and 24 h after thymidine synchronization, assessed by flow cytometry after staining with propidium iodide (PI). Values are presented as the mean ± SEM of triplicate experiments, and statistical analysis was performed by Student's t‐test (*p < 0.05, **p < 0.01).
Figure 3
Figure 3
CYLD ablation induces migration capacity of SMZL cell lines. (A), (B) Expression levels of the CCR7 chemokine receptor were determined in two control (CTL) and two CYLD KO (KO) clones of SL‐15 (A) and SL‐22 (B) cell lines using flow cytometry. Values are presented as the mean ± SEM of CD19+/CCR7+ percentages from at least three independent experiments. (C) Transendothelial migration analysis of one control (CTL) and two CYLD KO (KO) clones of SL‐15 and SL‐22 cell lines in the presence or absence of chemokines (CCL19 and CCL21) and after pre‐incubation with anti‐CCR7 antibody (CCR7 AB) or isotype control (IC). Values are shown as the mean ± SEM of three independent experiments. (D), (E) RT‐qPCR analysis of MMP9 mRNA expression in two control (CTL) and two CYLD KO (KO) clones of SL‐15 (D) and SL‐22 (E) cell lines. Values are shown as the mean ± SEM of relative mRNA levels from at least three independent experiments. Data were normalized to MMP9 expression of control CTL‐D4 or CTL‐C9 clone. (F) Immunoblot analysis of (phosphorylated) AKT and (phosphorylated) ERK1/2 in whole cell extracts from two control (CTL) and two CYLD KO (KO) clones of SL‐15 and SL‐22 cell lines. Cells were pre‐incubated with RPMI medium only or 10 μg/mL isotype control antibody (IC) or 10 μg/mL anti‐CCR7 antibody for 30 min. Then, 200 ng/mL CCL19 was added for 5 min and whole cell extracts were collected. The picture is representative of three independent experiments. (G) One control (CTL) and two CYLD KO (KO) clones of the SL‐15 SMZL cell line were injected intravenously in RAG2−/−γc−/− immunodeficient mice and were sacrificed after 3 weeks. CD19+/CD45+ cells were detected by flow cytometry in the peripheral blood (PB), liver (LI), peritoneal cavity (PC), and spleen (SP), 3 weeks after intravenous injection. Values are shown as the mean ± SEM of at least four mice. (H) Spleen weight analysis of at least four mice injected intravenously with one control (CTL) and two CYLD KO (KO) clones of SL‐15 SMZL cell line and sacrificed after 3 weeks. Values are shown as the mean ± SEM. (I) Representative picture of spleen analyzed in (I). (A)(H) Statistical differences were assessed by Student's t‐test (*,#,$ p < 0.05; **,##,$$ p < 0.01; ***p < 0.001).
Figure 4
Figure 4
MALT1‐mediated cleavage of CYLD induces migration through the CCR7 receptor. (A) Immunoblot analysis of CYLD and MALT1 expression in primary SMZL samples. For CYLD analysis we used an antibody that recognizes both the full length CYLD and a C‐terminal fragment of CYLD (CYLD‐Ct). B‐actin was used as a loading control. Representative picture of immunoblot analysis in 7 SMZL primary samples. (B) Quantification of MALT1 protein levels in patients with SMZL using the Image J software. Values are shown as the ratio of MALT1/B‐actin for each patient. (C) RT‐qPCR analysis of CCR7 mRNA expression in CYLDfull length and CYLDcleaved subgroups. Values are shown as the mean ± SEM of relative mRNA levels. (D) Expression levels of the CCR7 chemokine receptor were determined in CYLDfull length and CYLDcleaved subgroups using flow cytometry. Values are shown as the mean ± SEM of CD19+/CCR7+ percentages. (E) RT‐qPCR analysis of MMP9 mRNA expression in CYLDfull length and CYLDcleaved subgroups. Values are shown as the mean ± SEM of relative mRNA levels. (F) Tumor cells from three SMZL patients expressing full length CYLD were electroporated with the CRISPR/Cas9 system including control (CYLDfull length + sgCtl) and CYLD‐targeted (CYLDfull length + sgCyld) sgRNAs. RT‐qPCR was used to analyze CYLD, CCR7, IL6, ICAM1, CD80, and MMP9 mRNA expression in CYLDfull length + sgCtl and CYLDfull length + sgCyld groups. Values are shown as the mean ± SEM of relative mRNA levels. Data were normalized to mRNA expression of CYLDfull length + sgCtl group. (G) Representative immunoblot analysis of CYLD expression in tumor cells of samples analyzed in (F). (H) Transendothelial migration analysis of three CYLDfull length and CYLDcleaved SMZL patient samples in the presence or absence of chemokines (CCL19 and CCL21) and after pre‐incubation with anti‐CCR7 antibody (CCR7 AB) or isotype control (IC). Values are shown as the mean ± SEM. (I) Immunoblot analysis of CYLD expression in three CYLDcleaved SMZL patients treated with DMSO (vehicle) or MALT1 inhibitor MI‐2 (1 μM) for 6 h. (J) RT‐qPCR analysis of CCR7 mRNA expression in three CYLDcleaved SMZL patients treated with DMSO (vehicle) or MALT1 inhibitor MI‐2 (1 μM) for 24 h. Values are shown as the mean ± SEM of relative mRNA levels. (K) Expression levels of the CCR7 chemokine receptor were determined in three CYLDcleaved SMZL patients treated with DMSO (vehicle) or MALT1 inhibitor MI‐2 (1 μM) for 24 h, using flow cytometry. Values are shown as the mean ± SEM of CD19+/CCR7+ percentages. (L) Transendothelial migration analysis of three CYLDcleaved SMZL patients in the presence of CCL19 and CCL21 chemokines, after pre‐incubation with DMSO (vehicle) or MALT1 inhibitor MI‐2 (1 μM) for 6 h. Values are shown as the mean ± SEM. (M), (N) Proliferation analysis by Trypan blue exclusion assay (M) and MTT assay (N) of three CYLDcleaved SMZL patients treated with DMSO (vehicle) or MALT1 inhibitor MI‐2 (1 μM) for, 24, 48, and 72 h. Values are shown as the mean ± SEM. (C)–(N) Statistical differences were assessed by Student's t‐test (*,#,$ p < 0.05; **p < 0.01).
Figure 5
Figure 5
CYLD ablation induces BcR signaling pathway activation and confers resistance to Ibrutinib. (A) Immunoblot analysis of (phosphorylated) BTK, (phosphorylated) AKT, and (phosphorylated) ERK1/2 in whole cell extracts from two control (CTL) and two CYLD KO (KO) clones of SL‐15 and SL‐22 cell lines. The picture is representative of three independent experiments. (B) Parental SL‐15 and SL‐22 cell lines were treated with different ibrutinib concentrations (1, 2.5, 5, 10, and 20 μM) for 72 h, and viability was assessed by Trypan Blue exclusion and CellTiter Glo assay. IC50 value was calculated using a nonlinear regression tool from GraphPad Prism Version 9 software. (C), (D) Two control (CTL) and two CYLD KO (KO) clones of the SL‐15 cell line were grown in the presence or absence of 5 µM Ibrutinib for 24, 48, and 72 h. Proliferation analysis was assessed by CellTiter‐Glo (C) and Trypan blue exclusion (D) assays. The percentage of growth inhibition was calculated by the ratio between the number of live cells treated and the number of live cells of the respective vehicle (DMSO). Values are shown as the mean ± SEM of triplicate experiments and were analyzed by Student's t‐test (*p < 0.05, **p < 0.01). (E), (F) Two control (CTL) and two CYLD KO (KO) clones of the SL‐22 cell line were grown in the presence or absence of 10 µM Ibrutinib for 24, 48, and 72 h. Proliferation analysis was assessed by CellTiter‐Glo (E) and Trypan blue exclusion (F) assays. The percentage of growth inhibition was calculated by the ratio between the number of live cells treated and the number of live cells of the respective vehicle (DMSO). Values are shown as the mean ± SEM of triplicate experiments and were analyzed by Student's t‐test (*p < 0.05, **p < 0.01). (G), (H) SL‐15 CTL D4 and CYLD KO H11 cell lines were used to populate a spongostan scaffold and subsequently treated with ibrutinib. Line plot represents the number of cells mobilized (G) or remaining within the scaffolds (H), 16 h after the addition of ibrutinib compared to untreated cells. Values are presented as the mean ± SEM. Statistical differences were assessed by two‐way ANOVA followed by Fisher's test (*p < 0.05, ***p < 0.001).

References

    1. Armitage JO, Weisenburger DD. New approach to classifying non‐Hodgkin's lymphomas: clinical features of the major histologic subtypes. Non‐Hodgkin's Lymphoma Classification Project. J Clin Oncol. 1998;16(8):2780‐2795. - PubMed
    1. Martínez N, Almaraz C, Vaqué JP, et al. Whole‐exome sequencing in splenic marginal zone lymphoma reveals mutations in genes involved in marginal zone differentiation. Leukemia. 2014;28(6):1334‐1340. - PubMed
    1. Rossi D, Trifonov V, Fangazio M, et al. The coding genome of splenic marginal zone lymphoma: activation of NOTCH2 and other pathways regulating marginal zone development. J Exp Med. 2012;209(9):1537‐1551. - PMC - PubMed
    1. Clipson A, Wang M, de Leval L, et al. KLF2 mutation is the most frequent somatic change in splenic marginal zone lymphoma and identifies a subset with distinct genotype. Leukemia. 2015;29(5):1177‐1185. - PubMed
    1. Bikos V, Darzentas N, Hadzidimitriou A, et al. Over 30% of patients with splenic marginal zone lymphoma express the same immunoglobulin heavy variable gene: Ontogenetic implications. Leukemia. 2012;26(7):1638‐1646. - PubMed

LinkOut - more resources