. 2025 Mar 18;135(10):e181775.
doi: 10.1172/JCI181775. eCollection 2025 May 15.

Reactivation of CTLA4-expressing T cells accelerates resolution of lung fibrosis in a humanized mouse model

Affiliations

Reactivation of CTLA4-expressing T cells accelerates resolution of lung fibrosis in a humanized mouse model

Santosh Yadav et al. J Clin Invest. .

Abstract

Tissue regenerative responses involve complex interactions between resident structural and immune cells. Recent reports indicate that accumulation of senescent cells during injury repair contributes to pathological tissue fibrosis. Using tissue-based spatial transcriptomics and proteomics, we identified upregulation of the immune checkpoint protein, cytotoxic T lymphocyte-associated protein 4 (CTLA4), on CD8+ T cells adjacent to regions of active fibrogenesis in human idiopathic pulmonary fibrosis and in a repetitive bleomycin lung injury murine model of persistent fibrosis. In humanized CTLA4-knockin mice, treatment with ipilimumab, an FDA-approved drug that targets CTLA4, resulted in accelerated lung epithelial regeneration and diminished fibrosis from repetitive bleomycin injury. Ipilimumab treatment resulted in the expansion of Cd3e+ T cells, diminished accumulation of senescent cells, and robust expansion of type 2 alveolar epithelial cells, facultative progenitor cells of the alveolar epithelium. Ex vivo activation of isolated CTLA4-expressing CD8+ cells from mice with established fibrosis resulted in enhanced cytolysis of senescent cells, suggesting that impaired immune-mediated clearance of these cells contributes to persistence of lung fibrosis in this murine model. Our studies support the concept that endogenous immune surveillance of senescent cells may be essential in promoting tissue regenerative responses that facilitate the resolution of fibrosis.

Keywords: Fibrosis; Immunology; Immunotherapy; Pulmonology; T cells.


Conflict of interest statement

Conflict of interest: VJT has filed for a provisional patent for the use of pilimumab in idiopathic pulmonary fibrosis (US patent application 63/649,113).

Figures

Figure 1
Figure 1. Spatial transcriptomics of IPF fibroblastic foci suggests suppression of cellular immune responses.
(A and B) Spatial images of lung tissue sections from patients with IPF and healthy individuals acting as controls were acquired by digital spatial profiling (GeoMx) using fluorescence of pan-CK (cyan), CD31 (yellow), α-SMA (magenta), and DAPI (blue). Scale bar: 5 mm (A and B), 500 μm (higher-magnification images). (C) Volcano plot of differentially expressed genes with an FDR threshold of –log10 (P < 0.05). (DH) Bar plots showing read counts for ACTA2, COL1A1, COL3A1, COL6A1, and AGER. (I) GSEA Hallmark pathway analysis of differentially expressed genes, comparing IPF vs. control (n = 12 ROIs each; P < 0.05; normalized enrichment score ≥ 1.5). (J) IPA analysis was performed on differentially expressed genes of healthy individuals acting as controls and patients with IPF. The cellular immune response that is downregulated is highlighted in red. Data are shown as mean ± SEM. Statistical differences in DH were tested using a paired 2-tailed Student’s t test.
Figure 2
Figure 2. The immune checkpoint inhibitor CTLA4 is upregulated within fibrotic niches in the lungs of patients with IPF.
(A) Unsupervised hierarchically clustered heatmap of protein counts for IPF (n = 12 ROIs) and control (n = 12 ROIs). Protein profiling was performed with a 79-plex oligonucleotide–antibody cocktail for 24 ROIs. (B and C) Violin plots showing normalized read counts of α-SMA and CTLA4. Statistical comparisons are between reads from healthy individuals acting as controls (n = 12 ROIs) and patients with IPF (n = 12 ROIs). (D) Correlation of CTLA4 and ACTA2. Statistical comparisons are between reads from healthy individuals acting as controls (n = 12 ROIs) and patients with IPF (n = 12 ROIs). (E) UMAP of CTLA4 and PDCD1 expression in T cells from the Banovich/Kropski dataset in the IPF Cell Atlas (https://www.ipfcellatlas.com/). (F and G) CTLA4 and PDCD1 expression in T cells (patients with interstitial lung diseases [ILD] vs. healthy individuals). (H and I) Representative immunostaining images of lung tissues from healthy individuals acting as controls and patients with IPF (CTLA4, green; α-SMA, red; and DAPI, blue). Arrowheads indicate fibroblastic foci. Scale bar: 50 μm. (J and K) Expression of CTLA4 on CD8+ or CD4+ cells in lung tissues from patients with IPF (CTLA4, green; CD8+ T cell, red; CD4+T cell, red; and DAPI, blue). Arrowheads indicate colocalization of CTLA4 with CD8+ cells, but not CD4+ cells. Scale bar: 50 μm. Data are shown as mean ± SEM. Statistical differences in B, C, F, and G were tested using a paired 2-tailed Student’s t test.
Figure 3
Figure 3. CTLA4 is upregulated on CD8+ T cells adjacent to COL5A2-expressing cells in fibrotic regions of IPF lungs.
(A) Xenium spatial plot showing expression of COL5A2, CTLA4, AGER, and SFTPD in fibrotic regions. White circles indicate fibroblastic foci expressing COL5A2 (red) and adjacent cells expressing CTLA4. Scale bar: 2,000 μm. (B) Xenium spatial plot showing expression of COL8A1, CTLA4, AGER, and SFTPD in fibrotic regions. Scale bar: 2,000 μm. (C) Post-Xenium H&E staining of IPF lung tissue. Scale bar: 2,000 μm. (D) CTLA4 transcript levels in less fibrotic and fibrotic ROIs. Data are from 3 IPF lungs, with 5 fibrotic and less fibrotic regions analyzed per IPF lung. (EH) Xenium spatial plot showing expression of COL5A2, CD8, and CD4 and overlay in IPF lung. Scale bar: 2,000 μm. (I) Xenium spatial plot showing expression of COL5A2, CD8, and CD4 with a high-magnification image showing CTLA4 transcript expression on CD8+ T cells. (J) CTLA4 transcript numbers in CD4+ T cells vs. CD8+ T cells in IPF lungs. Scale bar: 500 μm; 50 μm (high-magnification image). Data are shown as mean ± SEM. Statistical differences in D and J were tested using a paired 2-tailed Student’s t test.
Figure 4
Figure 4. CTLA4 blockade in a mouse model of persistent lung fibrosis ameliorates fibrosis.
(A) Schematic representation of the humanized CTLA4-knockin mouse carrying the extracellular domain of CTLA4 gene. (B) Experimental outline of humanized CTLA4 mice subjected to repetitive bleomycin injury–induced pulmonary fibrosis via oropharyngeal administration of bleomycin (1.25 U per kg body weight) in 2 doses, 14 days apart. On day 21 after the second dose, mice were treated intraperitoneally with either control IgG1 isotype or the anti-CTLA4 monoclonal antibody ipilimumab at doses of 5 mg per kg body weight twice per week for 4.5 weeks (total of 9 doses). (C and D) Representative images of H&E- (C) and Masson’s trichrome–stained (D) whole lung sections from bleomycin-induced mice treated with either IgG1 isotype control or ipilimumab. Scale bar: 800 μm. (E) Quantitation of H&E staining in the IgG1 isotype control and ipilimumab groups. Images of H&E staining were quantified using QuPath software. Data represent IgG1 isotype control and ipilimumab (n = 6 in each group). (F) Quantitation of Masson’s trichrome staining in the IgG1 isotype control or ipilimumab groups. Collagen containing areas were identified with machine-learning algorithms using inForm automated image analysis software built into the PhenoImager Fusion (Akoya Biosciences). Data represent IgG1 isotype control and ipilimumab groups (n = 6 per group). (G) Whole-lung hydroxyproline content (μg/lung) in IgG1 isotype control and ipilimumab treated groups (n = 4 per group). Data are shown as mean ± SEM. Statistical differences in EG were tested using a paired 2-tailed Student’s t test.
Figure 5
Figure 5. Fibrosis resolution in mice with CTLA4 blockade is associated with activation of T cell subsets and expansion of alveolar type 2 cells.
(A) Experimental outline of humanized CTLA4 mice subjected to repetitive bleomycin injury–induced pulmonary fibrosis via oropharyngeal administration of bleomycin (1.25 U per kg body weight) in 2 doses,14 days apart. On day 21 after the second dose, mice were treated intraperitoneally with either control IgG1 isotype or the anti-CTLA4 monoclonal antibody ipilimumab at doses of 5 mg per kg body weight twice per week for 4.5 weeks (total of 9 doses). (B and C) UMAP of whole-lung cells from the IgG1 isotype control and ipilimumab groups. Cell clusters identified by scRNA-Seq are colored by cell type. The UMAP indicating the sftpa1+ cell cluster is highlighted with a hexagon. (D) Volcano plot showing differential gene expression in T cell clusters of the scRNA-Seq IgG1 isotype control and ipilimumab dataset. A total of 99 differentially expressed genes were identified [log2(fold change) > 0.3 and FDR-adjusted P < 0.05]. (E) Violin plot showing gene expression of Icos in the Cd3δ+ and Cd3ε+ T cell clusters of the scRNA-Seq data for whole lung cells from the IgG1 isotype control or ipilimumab groups. (F) Volcano plot showing differential gene expression in the sftpa1+ cell cluster of the scRNA-Seq dataset for the IgG1 isotype control and ipilimumab groups. A total of 399 differentially expressed genes were identified [log2(fold change) > 0.3, FDR-adjusted P < 0.05]. (GI) Violin plots showing AT2 cell expression of the marker genes sftpb, sftpc, and sftpd in the in sftpa1+ cell cluster.
Figure 6
Figure 6. Senescent cell accumulation is reduced in mice with resolving fibrosis.
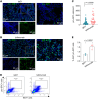
(A and B) Representative images of pro-SPC+ cells (green) and DAPI (blue) in IgG1 isotype control and ipilimumab groups. Scale bar: 50 μm. (C) Phenotyping of pro-SPC+ cells. Images were processed with machine-learning algorithms in inForm automated image analysis software built in PhenoImager Fusion. Spatial analysis of pro-SPC+ cells in IgG1 isotype control and ipilimumab groups (n = 30 per group, representing 6 ROIs from 5 mice per group). (D) Representative flow cytometry plots of Ki67+SPC cells in IgG1 and ipilimumab groups. (E) The percentage of SPC and Ki67+ cells in IgG1 isotype control and ipilimumab groups (n = 3 mice per group). Data are shown as mean ± SEM. Statistical differences in C and E were tested using a paired 2-tailed Student’s t test.
Figure 7
Figure 7. CTLA4 blockade decreases the accumulation of p16INK4a-expressing cells in vivo and mediates killing of senescent cells ex vivo.
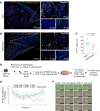
(A and B) Immunohistochemistry staining of p16INK4a in lung tissue sections from the 2 groups receiving either IgG1 isotype control or ipilimumab. Scale bar: 800 μm (left); 30 μm (right). (C) Quantitation of p16INK4a+ cells observed in high-power field (hpf) images of the IgG1 isotype control and ipilimumab (n = 4 in each group). (D) Schematic representation of ex vivo studies of CD8+ T cell–mediated killing. (E) Lung cells isolated from bleomycin-injured mice were stained with SPiDER-β-GAL and cocultured with CD8+ T cells (2:1 ratio) isolated from the same mice for 12 hours with or without ipilimumab (0.05 μg/mL). Real-time detection of fluorescent area of β-GAL+ cells/image (n = 16 images per condition at each time point indicated). (F) Images of CD8+ T cell–mediated killing of β-GAL+ lung cells. Images were taken using live-cell imaging with the IncuCyte system. The CD8+ T cells were labeled with Cellbright 640 (Biotium) (red) to visualize their interaction with β-GAL+ (green) lung cells. Data are shown as mean ± SEM. Statistical differences in C were tested using a paired 2-tailed Student’s t test.

References

    1. Raskov H, et al. Cytotoxic CD8+ T cells in cancer and cancer immunotherapy. Br J Cancer. 2021;124(2):359–367. doi: 10.1038/s41416-020-01048-4. - DOI - PMC - PubMed
    1. Henderson NC, et al. Fibrosis: from mechanisms to medicines. Nature. 2020;587(7835):555–566. doi: 10.1038/s41586-020-2938-9. - DOI - PMC - PubMed
    1. Thannickal VJ, et al. Fibrosis: ultimate and proximate causes. J Clin Invest. 2014;124(11):4673–4677. doi: 10.1172/JCI74368. - DOI - PMC - PubMed
    1. Hecker L, et al. Reversal of persistent fibrosis in aging by targeting Nox4-Nrf2 redox imbalance. Sci Transl Med. 2014;6(231):231ra47. doi: 10.1126/scitranslmed.3008182. - DOI - PMC - PubMed
    1. Schafer MJ, et al. Cellular senescence mediates fibrotic pulmonary disease. Nat Commun. 2017;8:14532. doi: 10.1038/ncomms14532. - DOI - PMC - PubMed

MeSH terms