. 2025 Jun;48(2):635-647.
doi: 10.1007/s13246-025-01530-4. Epub 2025 Mar 18.

Characteristics of the electron beam outside the applicator in an Elekta Versa HD Linac

Affiliations

Characteristics of the electron beam outside the applicator in an Elekta Versa HD Linac

Kapil Dev Maharaj et al. Phys Eng Sci Med. 2025 Jun.

Abstract

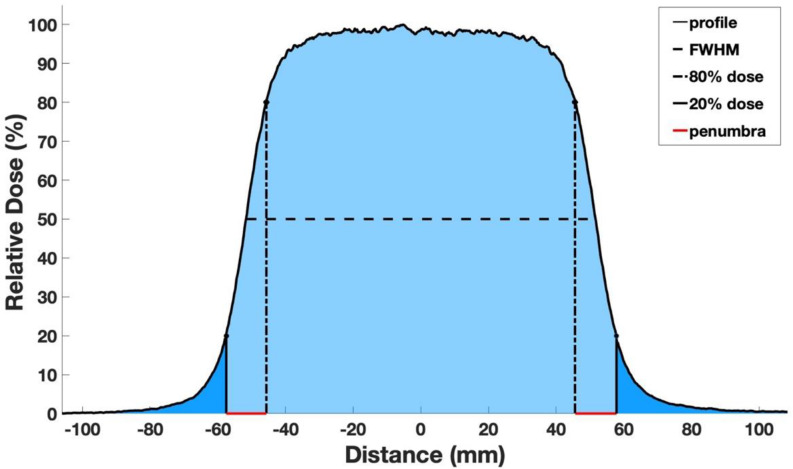
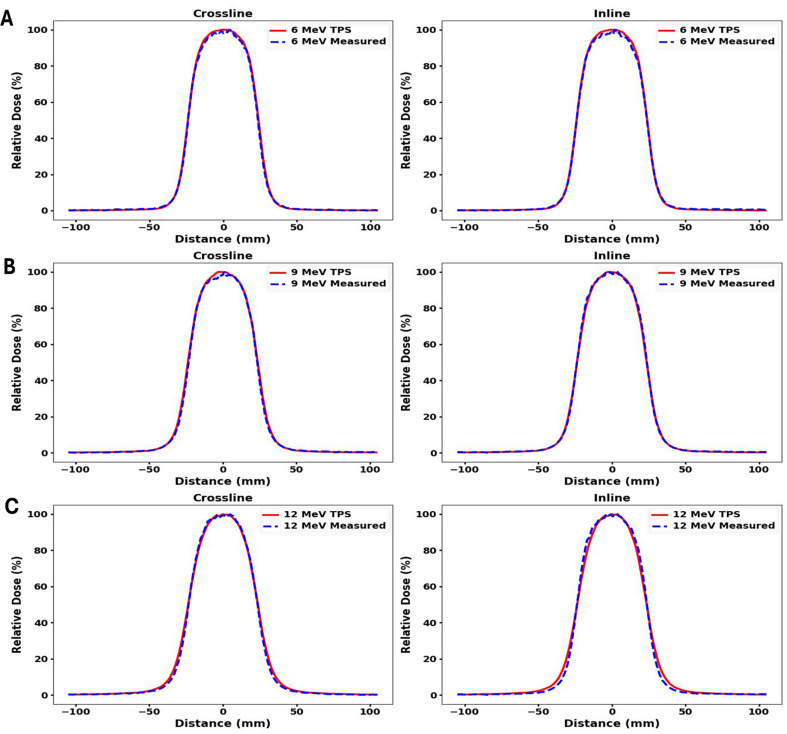
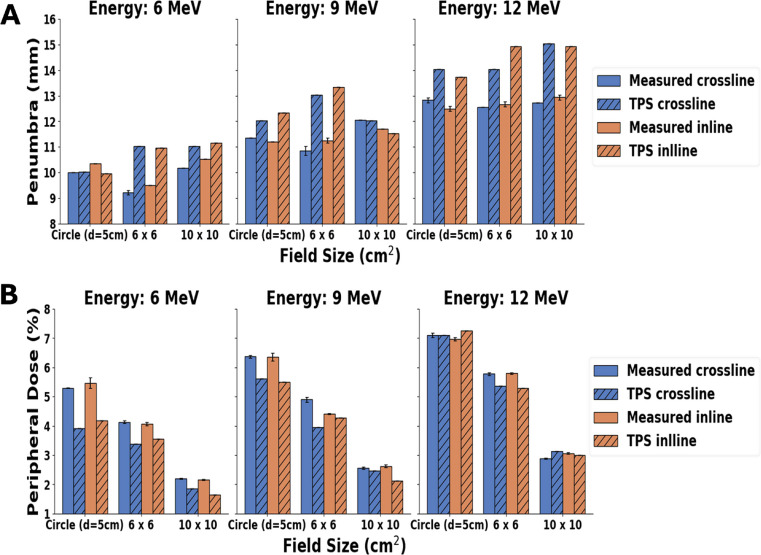
Radiotherapy is an essential component of cancer treatment, but healthy tissues can be exposed to out-of-field doses, potentially causing adverse effects and secondary cancers. This study investigates peripheral doses outside the electron beam applicator in an Elekta Versa HD linear accelerator. Peripheral doses outside an electron applicator were measured using 6, 9, and 12 MeV beams at their respective maximum dose depths while maintaining a 100 cm source-to-surface distance. Measurements employed EBT3 films within Plastic Water DT phantoms. The influence of field size on penumbra width and peripheral doses were examined using various cutouts (6 × 6 cm², 10 × 10 cm², and a 5 cm diameter circle) within a 10 × 10 cm² applicator, with gantry and collimator angles set to 0 degrees. Additionally, the impact of collimator angles on penumbra width and peripheral doses was explored, enhancing the understanding of dose distribution. Measured profiles were also compared with those calculated using Monaco treatment planning system. Findings showed that both penumbra width and peripheral dose values increased with energy across different field sizes and collimator angles. Root Mean Square Deviation (RMSD) analysis indicated deviations of 1.8 mm for penumbra and 1.1% for peripheral doses between measured profiles and Treatment Planning System (TPS) predictions for all field sizes. Peripheral doses remained below 5% of the maximum dose at distances ranging from 10 to 15 mm away from the field edges, indicating acceptable tolerance levels (ICRU report 24). However, further dose reduction may be possible with additional shielding to keep doses as low as reasonably achievable. This study highlights the critical importance of considering peripheral doses in radiotherapy, emphasizing the need to evaluate the impact on healthy tissues outside the primary treatment area to ensure patient safety and mitigate long-term treatment-related side effects. The findings underscore the necessity of implementing appropriate measures to minimize peripheral doses.

Keywords: Applicator; Electron therapy; Elekta versa HD; Linac; Out-of-field; Peripheral dose.


Conflict of interest statement

Declarations. Ethical approval and consent to participate: Not applicable. Consent for publication: Not applicable. Conflict of interest: The author(s) declared no potential conflicts of interest with respect to the research, authorship, and/or publication of this article.

Figures

Fig. 1
Fig. 1
Schematic illustration of the process from measurement to analysis. (1) Measurement setup (note that the vertical dashed lines do not represent the actual particle paths). (2) Exposed film marked and cut using a laser cutter. (3) Film readout. (4) Filter application. (5) Dose profile Extraction. (6) Dose profile with areas defined
Fig. 2
Fig. 2
Profile depicting the key parameters, including the Full Width at Half Maximum (FWHM), the peripheral dose (represented by the dark blue area, signifying values falling below 20% of the maximum dose), and the penumbra width (highlighted in red)
Fig. 3
Fig. 3
Comparison of in-plane and cross-plane profiles between measured and TPS-calculated data for a 5 cm diameter circle cutout in 10 × 10 cm2 applicator. Measurements were made at Dmax in (A) 6 MeV (B) 9 MeV and (C) 12 MeV beam with gantry and collimator angles set to 0 degrees
Fig. 4
Fig. 4
Comparison of in-plane and cross-plane profiles between measured and TPS-calculated data for a 6 × 6 cm2 cutout in 10 × 10 cm2 applicator. Measurements were made at Dmax in (A) 6 MeV (B) 9 MeV and (C) 12 MeV beam with gantry and collimator angles set to 0 degree
Fig. 5
Fig. 5
Comparison of in-plane and cross-plane profiles between measured and TPS-calculated data for a 10 × 10 cm2 cutout in 10 × 10 cm2 applicator. Measurements were made at Dmax in (A) 6 MeV (B) 9 MeV and (C) 12 MeV beam with gantry and collimator angles set to 0 degree
Fig. 6
Fig. 6
In-plane and cross-plane profiles for 0- and 180-degrees collimator angles. Measurements were performed at Dmax in a (A) 6 MeV (B) 9 MeV and (C) 12 MeV beam with 10 × 10 cm² cutout and applicator and gantry angle set to 0 degree
Fig. 7
Fig. 7
Comparative analysis between the measured and TPS-calculations for (A) the physical penumbra widths and (B) peripheral doses at the depth of maximum dose (Dmax). The evaluations were performed for three different cutouts (Circle 5 cm diameter, 6 × 6 cm², and 10 × 10 cm²) ina 10 × 10 cm² applicator. Assessments were carried out in 6 MeV, 9 MeV, and 12 MeV beams, with both gantry and collimator angles set to 0 degrees
Fig. 8
Fig. 8
Peripheral doses for all field sizes across all energies for measured and TPS-calculated profiles. Peripheral dose values are averaged for crossline and inline profiles. Vertical lines indicate the standard deviation between crossline and inline peripheral dose values
Fig. 9
Fig. 9
Measured (A) Penumbra width (B) Peripheral dose at Dmax using 0 and 180-degree collimator angles for a 10 × 10 cm2 applicator and cutout for 6, 9 and 12 MeV beams at gantry 0 degree
Fig. 10
Fig. 10
The crossline out of field profiles measured and calculated using Monaco TPS in 6, 9 and 12 MeV electron beams, using a standard 10 × 10 cm2 applicator and cutout, with gantry and collimator angles set to 0 degree measured at Dmax for each beam. (A) left side (B) right side. Note: Vertical lines indicate the field edge
Fig. 11
Fig. 11
The absolute difference in penumbra width between the two collimator angles (0 and 180 degrees) for the average of crossline and inline measurements for 6, 9 and 12 MeV

Similar articles

References

    1. Dracham CB, Shankar A, Madan R (2018) Radiation induced secondary malignancies: a review Article. Radiat Oncol J 36(2):85–94 - PMC - PubMed
    1. ICRP, Stewart FA, Akleyev AV et al (2012) ICRP publication 118: ICRP statement on tissue reactions and early and late effects of radiation in normal tissues and organs–threshold doses for tissue reactions in a radiation protection context. Ann ICRP 41:1–322 - PubMed
    1. Khan FM, Gibbons JP (2014) Khan’s the physics of radiation therapy. 5th Edition ed. Philadelphia: Lippincott Williams & Wilkins
    1. Podgoršak EB (2006) Radiation physics for medical physicists. Biological and medical physics, biomedical engineering. Springer, Berlin;
    1. Yeboah C et al (2010) Quantification and reduction of peripheral dose from leakage radiation on Siemens primus accelerators in electron therapy mode. J Appl Clin Med Phys 11(3):3105 - PMC - PubMed

LinkOut - more resources