. 2025 Mar 18;135(10):e181754.
doi: 10.1172/JCI181754. eCollection 2025 May 15.

Absence of the intracellular lipolytic inhibitor G0S2 enhances intravascular triglyceride clearance and abolishes diet-induced hypertriglyceridemia

Affiliations

Absence of the intracellular lipolytic inhibitor G0S2 enhances intravascular triglyceride clearance and abolishes diet-induced hypertriglyceridemia

Yongbin Chen et al. J Clin Invest. .

Abstract

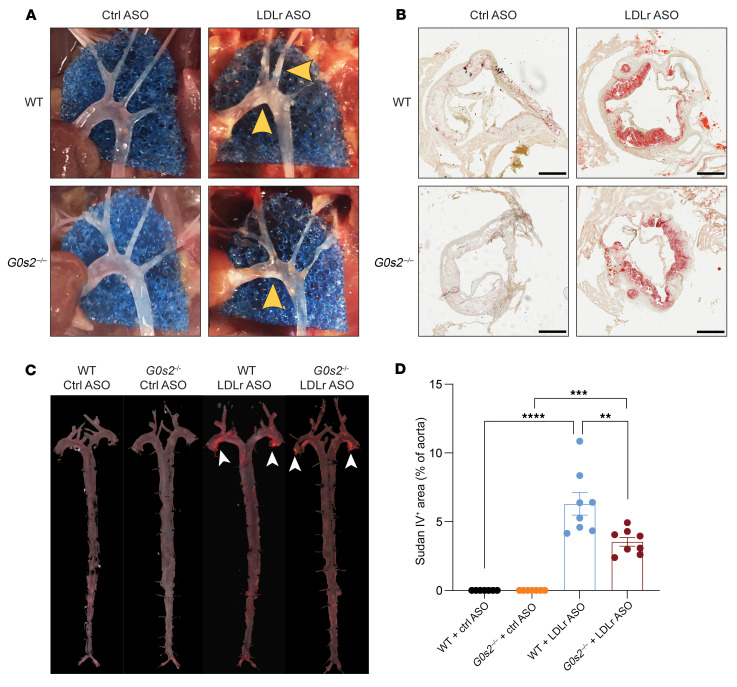
The interplay between intracellular and intravascular lipolysis is crucial for maintaining circulating lipid levels and systemic energy homeostasis. Adipose triglyceride lipase (ATGL) and lipoprotein lipase (LPL), the primary triglyceride (TG) lipases responsible for these two spatially separate processes, are highly expressed in adipose tissue. Yet the mechanisms underlying their coordinated regulation remain undetermined. Here, we demonstrate that genetic ablation of G0S2, a specific inhibitory protein of ATGL, completely abolished diet-induced hypertriglyceridemia and significantly attenuated atherogenesis in mice. These effects were attributable to enhanced whole-body TG clearance, not altered hepatic TG secretion. Specifically, G0S2 deletion increased circulating LPL concentration and activity, predominantly through LPL production from white adipose tissue (WAT). Strikingly, transplantation of G0S2-deficient WAT normalized plasma TG levels in mice with hypertriglyceridemia. In conjunction with improved insulin sensitivity and decreased ANGPTL4 expression, the absence of G0S2 enhanced the stability of LPL protein in adipocytes, a phenomenon that could be reversed upon ATGL inhibition. Collectively, these findings highlight the pivotal role of adipocyte G0S2 in regulating both intracellular and intravascular lipolysis, and the possibility of targeting G0S2 as a viable pharmacological approach to reducing levels of circulating TGs.

Keywords: Adipose tissue; Atherosclerosis; Endocrinology; Metabolism; Obesity.


Conflict of interest statement

Conflict of interest: The authors have declared that no conflict of interest exists.

Figures

Figure 1
Figure 1. G0s2 ablation decreases plasma TG in mice treated with Ldlr-ASO and Western diet.
(A) Mouse model building scheme. Seven-week-old male WT and G0s2–/– mice were fed a Western diet and treated with either control or Ldlr-ASO weekly for 12 weeks. (B) Western blot analysis of mouse liver for LDLR and G0S2. (C and D) Fasting plasma levels of TG (C) and total cholesterol, free cholesterol, and cholesterol ester (D) after diet treatment (n = 10). Chol., cholesterol. (E and F) FPLC analysis of pooled plasma TG (E) and total cholesterol (F) (n = 10), with AUC quantification (insets). (G) Fasting plasma free FA (FFA) levels (n = 7). Data represent mean ± SEM. **P < 0.01, ****P < 0.0001 by 1-way (C and G) or 2-way ANOVA (D).
Figure 2
Figure 2. G0s2 deficiency attenuates atherosclerosis.
(A) Representative images showing plaque formation (yellow arrowheads) in aortic arch. (B) Representative images of plaques in the aortic root sections with Oil Red O staining. Scale bars: 300 μm. (C) Representative images of en face Sudan IV–stained aortas with plaques indicated by white arrowheads at aortic roots. (D) Quantification of Sudan IV positive areas of total aorta (n = 8). Data represent mean ± SEM. **P < 0.01, ***P < 0.001, ****P < 0.0001 by 1-way ANOVA (D).
Figure 3
Figure 3. G0s2 ablation decreases adiposity and increases whole-body lipid oxidation.
(A) Time course of relative body weight changes in mice treated with Ldlr-ASO and Western diet (n = 10). (B) Body composition at the end of Ldlr-ASO and diet treatment (n = 7). (C) Time course of weekly food consumption during diet treatment (n = 10). (DF) Real-time curve of oxygen consumption (D), RER (E), and total energy expenditure (F) during the feeding/fasting/refeeding cycle (n = 10). Data represent mean ± SEM. *P < 0.05, **P < 0.01by unpaired 2-tailed t tests (A and CF) or 2-way ANOVA (B). Statistical analysis of metabolic cage data was performed by comparison of the average value of each day or night period.
Figure 4
Figure 4. G0s2 ablation improves whole-body TG clearance without affecting hepatic TG secretion in mice treated with ASO and Western diet.
(A) Time course of plasma TG levels during OLTT (n = 10). (B) iAUC analysis of OLTT plasma TG curve (n = 10). (C) Hepatic TG and cholesterol content (n = 10). (D) Representative images of liver sections with H&E staining. Scale bars: 100 μm. (E) Hepatic TG secretion assay after Poloxamer 407 administration (n = 6). (F) Fecal TG content (n = 10). (G) Circulating LPL activity 10 minutes after PBS or heparin administration, as determined following a 15-minute reaction of plasma with an artificial substrate (detailed in Methods). Data represent mean ± SEM. *P < 0.05, **P < 0.01, ***P < 0.001, ****P < 0.0001 by unpaired 2-tailed t tests (A, B, E, and F) or 2-way ANOVA (C and G).
Figure 5
Figure 5. G0s2 ablation increases oral lipid tolerance and LPL production in chow-fed mice.
(A) Time course of plasma TG levels during OLTT (n = 8). (B) iAUC analysis of OLTT plasma TG curve (n = 8). (C) Fecal TG content (n = 8). (D) Circulating lipase activity 10 minutes after PBS or heparin administration, as determined following a 60-minute reaction of plasma with the artificial substrate. (E) Circulating LPL protein concentration 10 minutes after PBS or heparin administration (n = 11). (F) Tissue-specific LPL activity (n = 5). (G) Tissue distribution of 3H radioactivity in mice 2 hours after oral gavage of [3H]-labeled triolein (n = 15). Data represent mean ± SEM. *P < 0.05, **P < 0.01, ***P < 0.001, ****P < 0.0001 by unpaired 2-tailed t tests (AC) or 2-way ANOVA (DG).
Figure 6
Figure 6. Transplantation with G0s2–/– WAT alleviates hypertriglyceridemia in WT recipient mice.
(A) Experimental scheme: After 3 weeks of treatment with Western diet (WD) and Ldlr-ASO, epididymal WAT dissected from chow-fed WT or G0s2–/– donor mice was transplanted in situ into WT recipient mice. (B) Plasma TG concentrations prior to and after transplantation at the indicated time points (n = 9–10). (C and D) Circulating lipase activity 10 minutes after heparin administration, as determined following a 15-minute reaction of plasma with the artificial substrate (C), and LPL protein concentration (D) during fasting or refeeding 4 weeks after transplantation (n = 9–10). (EG) Fasting plasma levels or free FA (E), total cholesterol (F), and glucose (G) at the end point (n = 9–10). (H) Liver TG content normalized to liver weight at the end point (n = 9–10). (I). Fasting plasma β-hydroxybutyrate (BHB) levels (n = 9–10). Data represent mean ± SEM. *P < 0.05, **P < 0.01, ***P < 0.001, ****P < 0.0001 by unpaired 2-tailed t tests (B, and EI) or 2-way ANOVA (C and D).
Figure 7
Figure 7. G0s2 ablation causes opposite changes in LPL and ANGPTL4 expression while increasing insulin sensitivity in adipocytes.
(A) Circulating post-heparin lipase activity in chow-fed mice before and 1 hour after insulin stimulation (n = 12). (B) Post-heparin lipase activity in the media of WAT explants without or with insulin stimulation for 45 minutes (n = 7). For both A and B, lipase activity was determined following a 60-minute reaction of plasma with the artificial substrate. (C) Western blot analysis of proteins in epididymal WAT after 4-hour refeeding. (D) qPCR analysis of relative mRNA expression in epididymal WAT after 4-hour refeeding (n = 7). (E) Western blot analysis of 3T3-F442A adipocytes transfected with control, G0S2-specific, and/or ANGPTL4 siRNA. (F) qPCR analysis of mRNA expression in transfected 3T3-F442A adipocytes. (G) Western blot analysis of transfected 3T3-F442A adipocytes after treatment with or without 100 nM insulin for 15 minutes. Data represent mean ± SEM. *P < 0.05, **P < 0.01, ***P < 0.001, ****P < 0.0001 by 2-way ANOVA (A, B, D, and F). All cell experiments were conducted 3 times, with similar results, and a representative image is shown.
Figure 8
Figure 8. Absence of G0s2 increases LPL protein stability in adipocytes.
(AC) Western blot analysis of protein expression in 3T3-F442A adipocytes transfected with either control or G0S2-specific siRNA and then treated with CHX in the presence of vehicle alone (A), 100 nM insulin (B),or 100 nM insulin + 10 μM Atglistatin (C) for the indicated time points. (DF) Relative quantification of LPL protein levels in A (D), B (E), and C (F). (G) Western blot analysis of SVF-derived adipocytes treated with CHX for indicated periods (s.e., short exposure; l.e., long exposure). (H) Relative quantification of LPL intensity in G. All cell experiments were conducted 3 times with similar results and a representative image is shown.

Similar articles

References

    1. Zwick RK, et al. Anatomical, physiological, and functional diversity of adipose tissue. Cell Metab. 2018;27(1):68–83. doi: 10.1016/j.cmet.2017.12.002. - DOI - PMC - PubMed
    1. Fruhbeck G. Overview of adipose tissue and its role in obesity and metabolic disorders. Methods Mol Biol. 2008;456:1–22. doi: 10.1007/978-1-59745-245-8_1. - DOI - PubMed
    1. Zhang R, Zhang K. A unified model for regulating lipoprotein lipase activity. Trends Endocrinol Metab. 2024;35(6):490–504. doi: 10.1016/j.tem.2024.02.016. - DOI - PMC - PubMed
    1. Wu SA, et al. Lipoprotein lipase and its regulators: an unfolding story. Trends Endocrinol Metab. 2021;32(1):48–61. doi: 10.1016/j.tem.2020.11.005. - DOI - PMC - PubMed
    1. Yang A, Mottillo EP. Adipocyte lipolysis: from molecular mechanisms of regulation to disease and therapeutics. Biochem J. 2020;477(5):985–1008. doi: 10.1042/BCJ20190468. - DOI - PMC - PubMed

MeSH terms