

Evaluating Quantitative Metagenomics for Environmental Monitoring of Antibiotic Resistance and Establishing Detection Limits
- PMID: 40100955
- PMCID: PMC11966778
- DOI: 10.1021/acs.est.4c08284
Evaluating Quantitative Metagenomics for Environmental Monitoring of Antibiotic Resistance and Establishing Detection Limits
Abstract
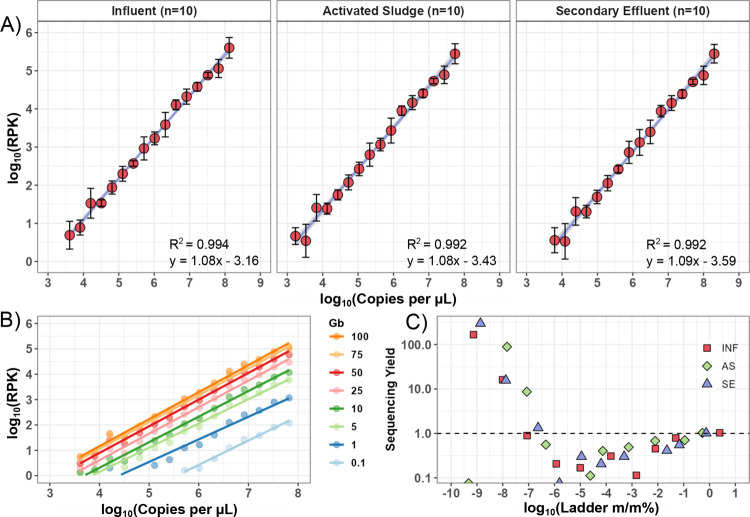
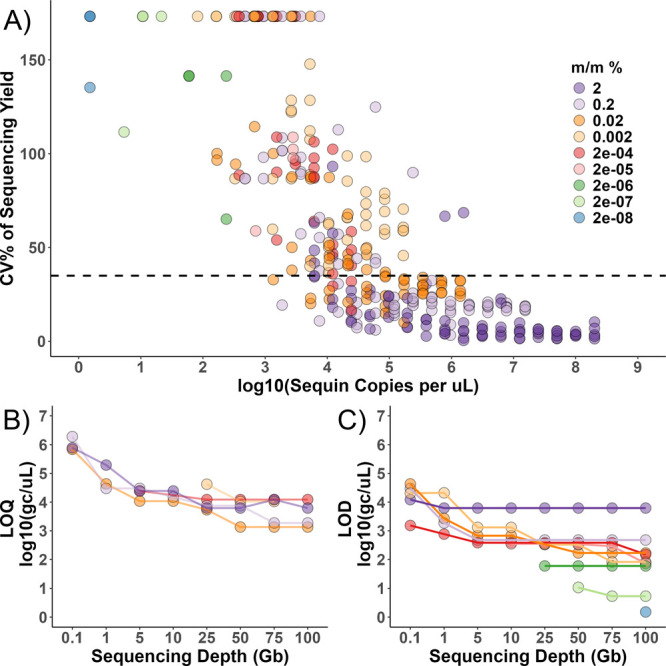
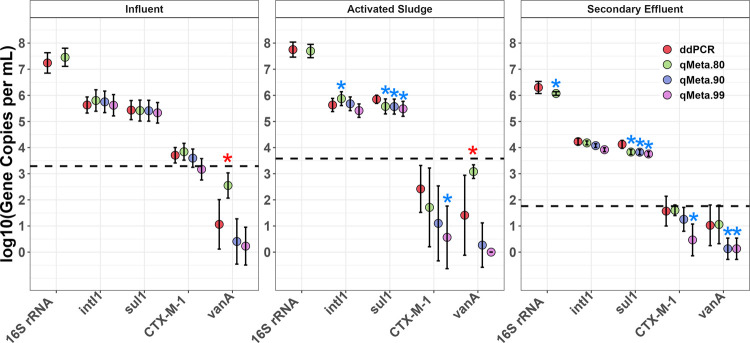
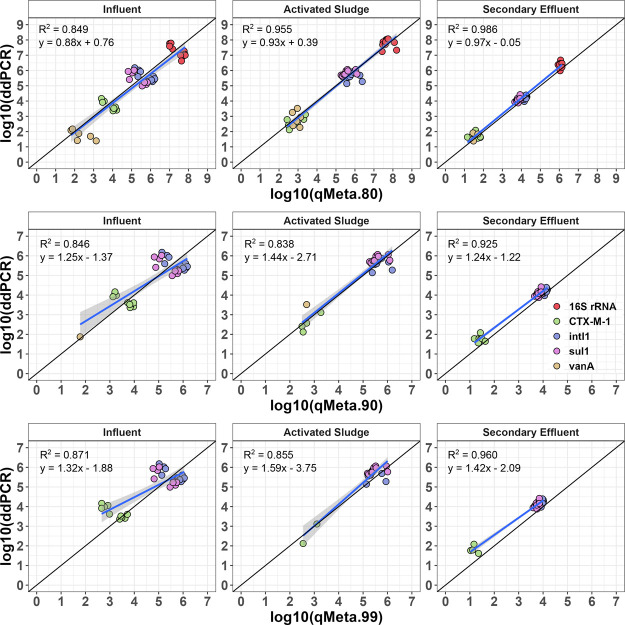
Metagenomics holds promise as a comprehensive, nontargeted tool for environmental monitoring. However, one key limitation is that the quantitative capacity of metagenomics is not well-defined. Here, we demonstrated a quantitative metagenomic technique and benchmarked the approach for wastewater-based surveillance of antibiotic resistance genes. To assess the variability of low-abundance oligonucleotide detection across sample matrices, we spiked DNA reference standards (meta sequins) into replicate wastewater DNA extracts at logarithmically decreasing mass-to-mass percentages (m/m%). Meta sequin ladders exhibited strong linearity at input concentrations as low as 2 × 10⁻³ m/m% (R2 > 0.95), with little to no reference length or GC bias. At a mean sequencing depth of 94 Gb, the limits of quantification (LoQ) and detection were calculated to be 1.3 × 10³ and 1 gene copy per μL DNA extract, respectively. In wastewater influent, activated sludge, and secondary effluent samples, 27.3, 47.7, and 44.3% of detected genes were ≤LoQ, respectively. Volumetric gene concentrations and log removal values were statistically equivalent between quantitative metagenomics and ddPCR for 16S rRNA, intI1, sul1, CTX-M-1, and vanA. The quantitative metagenomics benchmark here is a key step toward establishing metagenomics for high-throughput, nontargeted, and quantitative environmental monitoring.
Keywords: antibiotic resistance; environmental monitoring; internal standards; limit of detection; limit of quantification; quantitative metagenomics.
Conflict of interest statement
The authors declare no competing financial interest.
Figures
Similar articles
-
Metagenomic Quantification of Genes with Internal Standards.mBio. 2021 Feb 2;12(1):e03173-20. doi: 10.1128/mBio.03173-20. mBio. 2021. PMID: 33531401 Free PMC article.
-
Metagenomic profiling and transfer dynamics of antibiotic resistance determinants in a full-scale granular sludge wastewater treatment plant.Water Res. 2022 Jul 1;219:118571. doi: 10.1016/j.watres.2022.118571. Epub 2022 May 11. Water Res. 2022. PMID: 35576763
-
A Quantitative Metagenomic Sequencing Approach for High-Throughput Gene Quantification and Demonstration with Antibiotic Resistance Genes.Appl Environ Microbiol. 2021 Jul 27;87(16):e0087121. doi: 10.1128/AEM.00871-21. Epub 2021 Jul 27. Appl Environ Microbiol. 2021. PMID: 34085862 Free PMC article.
-
Metagenomic Profiling of Internationally Sourced Sewage Influents and Effluents Yields Insight into Selecting Targets for Antibiotic Resistance Monitoring.Environ Sci Technol. 2024 Sep 17;58(37):16547-16559. doi: 10.1021/acs.est.4c03726. Epub 2024 Sep 4. Environ Sci Technol. 2024. PMID: 39229966 Free PMC article.
-
Antibiotic Resistance Dissemination and Mapping in the Environment Through Surveillance of Wastewater.J Basic Microbiol. 2025 Mar;65(3):e2400330. doi: 10.1002/jobm.202400330. Epub 2024 Dec 15. J Basic Microbiol. 2025. PMID: 39676299 Review.
Cited by
-
Wastewater surveillance reveals patterns of antibiotic resistance across the United States.medRxiv [Preprint]. 2025 Apr 4:2025.04.02.25325128. doi: 10.1101/2025.04.02.25325128. medRxiv. 2025. PMID: 40236432 Free PMC article. Preprint.
References
-
- Alcock B. P.; Raphenya A. R.; Lau T. T. Y.; Tsang K. K.; Bouchard M.; Edalatmand A.; Huynh W.; Nguyen A. V.; Cheng A. A.; Liu S.; Min S. Y.; Miroshnichenko A.; Tran H. K.; Werfalli R. E.; Nasir J. A.; Oloni M.; Speicher D. J.; Florescu A.; Singh B.; Faltyn M.; Hernandez-Koutoucheva A.; Sharma A. N.; Bordeleau E.; Pawlowski A. C.; Zubyk H. L.; Dooley D.; Griffiths E.; Maguire F.; Winsor G. L.; Beiko R. G.; Brinkman F. S. L.; Hsiao W. W. L.; Domselaar G. V.; McArthur A. G. CARD 2020: antibiotic resistome surveillance with the comprehensive antibiotic resistance database. Nucleic Acids Res. 2019, 48 (D1), D517–D525. 10.1093/nar/gkz935. - DOI - PMC - PubMed
-
- Medema G.; Heijnen L.; Elsinga G.; Italiaander R.; Brouwer A. Presence of SARS-Coronavirus-2 RNA in Sewage and Correlation with Reported COVID-19 Prevalence in the Early Stage of the Epidemic in The Netherlands. Environmental Science & Technology Letters 2020, 7 (7), 511–516. 10.1021/acs.estlett.0c00357. - DOI - PubMed
MeSH terms
Substances
LinkOut - more resources
Full Text Sources
Medical
Miscellaneous
