. 2025 Apr 11;11(4):998-1007.
doi: 10.1021/acsinfecdis.4c01045. Epub 2025 Mar 18.

Identification of a New FtsZ Inhibitor by Virtual Screening, Mechanistic Insights, and Structure-Activity Relationship Analyses

Affiliations

Identification of a New FtsZ Inhibitor by Virtual Screening, Mechanistic Insights, and Structure-Activity Relationship Analyses

Pietro Sciò et al. ACS Infect Dis. .

Abstract

Antimicrobial resistance (AMR) poses a major threat to human health globally. Approximately 5 million deaths were attributed to AMR in 2019, and this figure is predicted to worsen, reaching 10 million deaths by 2050. In the search for new compounds that can tackle AMR, FtsZ inhibitors represent a valuable option. In the present study, a structure-based virtual screening is reported, which led to the identification of derivative C11 endowed with an excellent minimum inhibitory concentration value of 2 μg/mL against Staphylococcus aureus. Biochemical assays clarified that compound C11 targets FtsZ by inhibiting its polymerization process. C11 also showed notable antimicrobial activity against S. aureus cystic fibrosis isolates and methicillin-resistant S. aureus strains. Derivative C11 did not show cytotoxicity, while it had a synergistic effect with methicillin. C11 also showed increased survival in the Galleria mellonella infection model. Lastly, structure-activity relationship and binding mode analyses were reported.

Keywords: FtsZ; antibiotics; antimicrobial resistance; drug discovery; virtual screening.


Conflict of interest statement

The authors declare no competing financial interest.

Figures

Figure 1
Figure 1
Small molecule FtsZ inhibitors.
Figure 2
Figure 2
C11 structure and biological activity.
Figure 3
Figure 3
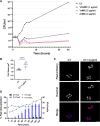
FtsZSa polymerization in the presence of C11. (A) Sedimentation assay of FtsZSa in the presence of 100 μM of C11. GDP was used as a negative control of the reaction. (P: pellet fraction; S: supernatant fraction). (B) Right-angle light scattering of FtsZSa in the presence of increasing concentration of C11. GTP was added after 75 s of incubation. (C) Dose-response curve of FtsZSa residual polymerization activity with C11. Data are the mean ± SD of the results from three different replicates. (D) Typical micrograph of FtsZSa at cryo-electron microscope in the absence (left, CT) or in the presence of 100 μM of C11 (right). The scale bar represents 50 nm. Data and images are representative of the results from three different replicates.
Figure 4
Figure 4
C11 effect on S. aureus ATCC25923 growth. (A) Time-killing curve of S. aureus ATCC25923 exposed to C11. A S. aureus ATCC25923 culture in the exponential phase of growth was split and concentrations of C11 corresponding to 1/2-, 1-, and 2-fold the MIC value were added. The viable counts were determined at 37 °C over 24 h. (B) Measurements of cell areas of S. aureus ATCC25923 untreated and treated with 4 μg/mL of C11. Statistically significant differences are indicated (unpaired t-test, ****p < 0.0001). (C) Fluorescence microscopy images of S. aureus TD276, carrying the FtsZ-mCherry (red) construct, untreated (CT) and treated with 4 μg/mL of C11. Cells were stained also with Hoechst (1 μg/mL) (blue). The scale bar corresponds to 2 μm. (D) Graphical representation of the percentage of cells showing FtsZ delocalization (left y axis-bars), during growth (right y axis-lines) in the absence (black), or in the presence (violet) of 4 μg/mL C11, in time-lapse experiments. Data and images are representative of the results of at least three different experiments.
Figure 5
Figure 5
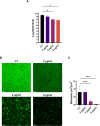
C11 effect on biofilm inhibition. (A) Bacterial biofilms of S. aureus ATCC25923 were grown in the presence of increasing concentrations of C11. The results are expressed as CFU/ml recovered after 24 h of incubation. (B) CLSM images of S. aureus ATCC25923 biofilms grown in “μ-Slide 4 Well Ibidi treated”. Cells were grown overnight at 37 °C in TSB + 1% glucose with no C11 (CT), 2, 4, or 8 μg/mL C11. Planes at equal distances (0.3 μm) along the Z-axis of the biofilm were imaged by CLSM. These 2D images were the maximum projection of the planes. Scale bar represents 15 μm. (C) Analysis of biofilm properties by COMSTAT 2. Measures of the total biomass of the biofilms in the presence of increasing concentrations of C11. Data are the mean ± SD of the results from three independent replicates. Images are representative of at least three different experiments. *p < 0.05, ***p < 0.001 (one-way ANOVA test).
Figure 6
Figure 6
Cytotoxicity of C11 on A549 using MTT assay. Different C11 concentrations (3.125–25 μM) and different times of incubation (3, 6, or 24 h) were assayed. Data are presented as mean value ±SD calculated on triplicate experiments. *p < 0.05, **p < 0.01 (unpaired t-test).
Figure 7
Figure 7
Kaplan–Meier survival curve of G. mellonella larvae infected with S. aureus ATCC25923 and treated with 8% DMSO (violet) or C11 (yellow). As a control, larvae were treated with saline solution and C11, saline solution and 8% DMSO (red), or untreated (black). The experiment was performed three times. Statistically significant differences are indicated (Significance level for each time point was evaluated with Fisher’s test: 48 h p < 0.001, 72 h p < 0.01, and 144 h p < 0.05).
Figure 8
Figure 8
Proposed binding mode of C11. The enzyme is reported as blue cartoon, C11 is depicted as gray sticks. The residues involved in interaction are reported as white lines, polar interactions are reported as yellow dotted lines.

References

    1. Naghavi M.; Mestrovic T.; Gray A.; Gershberg Hayoon A.; Swetschinski L. R.; Robles Aguilar G.; Davis Weaver N.; Ikuta K. S.; Chung E.; Wool E. E.; et al. Global burden associated with 85 pathogens in 2019: a systematic analysis for the Global Burden of Disease Study 2019. Lancet Infect. Dis. 2024, 24 (8), 868–895. 10.1016/S1473-3099(24)00158-0. - DOI - PMC - PubMed
    1. Ruggieri F.; Compagne N.; Antraygues K.; Eveque M.; Flipo M.; Willand N. Antibiotics with novel mode of action as new weapons to fight antimicrobial resistance. Eur. J. Med. Chem. 2023, 256 (256), 115413.10.1016/j.ejmech.2023.115413. - DOI - PubMed
    1. Beyer P.; Paulin S. The antibacterial research and development pipeline needs urgent solutions. ACS Infect Dis 2020, 6 (6), 1289–1291. 10.1021/acsinfecdis.0c00044. - DOI
    1. Ribeiro C. M. P.; Higgs M. G.; Muhlebach M. S.; Wolfgang M. C.; Borgatti M.; Lampronti I.; Cabrini G. Revisiting Host-Pathogen Interactions in Cystic Fibrosis Lungs in the Era of CFTR Modulators. Int. J. Mol. Sci. 2023, 24 (5), 5010.10.3390/ijms24055010. - DOI - PMC - PubMed
    1. Du S.; Lutkenhaus J. Assembly and activation of the Escherichia coli divisome. Mol. Microbiol. 2017, 105 (2), 177–187. 10.1111/mmi.13696. - DOI - PMC - PubMed

MeSH terms