. 2025 May 1;32(5):824-837.e5.
doi: 10.1016/j.stem.2025.02.010. Epub 2025 Mar 17.

Vascular network-inspired diffusible scaffolds for engineering functional midbrain organoids

Affiliations

Vascular network-inspired diffusible scaffolds for engineering functional midbrain organoids

Hongwei Cai et al. Cell Stem Cell. .

Abstract

Organoids, 3D organ-like tissue cultures derived from stem cells, show promising potential for developmental biology, drug discovery, and regenerative medicine. However, the function and phenotype of current organoids, especially neural organoids, are still limited by insufficient diffusion of oxygen, nutrients, metabolites, signaling molecules, and drugs. Herein, we present vascular network-inspired diffusible (VID) scaffolds to mimic physiological diffusion physics for generating functional organoids and phenotyping their drug response. Specifically, the VID scaffolds, 3D-printed meshed tubular channel networks, successfully engineer human midbrain organoids almost without necrosis and hypoxia in commonly used well plates. Compared with conventional organoids, these engineered organoids develop more physiologically relevant features and functions, including midbrain-specific identity, oxygen metabolism, neuronal maturation, and network activity. Moreover, these engineered organoids also better recapitulate pharmacological responses, such as neural activity changes to fentanyl exposure, compared with conventional organoids with significant diffusion limits. This platform may provide insights for organoid development and therapeutic innovation.

Keywords: diffusion; drug response; electrophysiology; organoids; perfusion; scaffolds; vascular networks.


Conflict of interest statement

Declaration of interests The manuscript comes with a patent entitled “Device and methods for engineering perfusable 3D cell cultures” (Application# 63/665,708).

Figures

Figure 1.
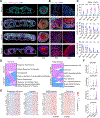
Figure 1.. Generation of engineered neural organoids using VID scaffolds
(A) Schematic for generating engineered neural organoids (e.g., midbrain organoids) using Vascular network-Inspired Diffusible (VID) scaffolds within multi-well plates. (B) Representative bright-field images showing the engineered neural organoids at different time points in 96 well plates and 6 well plates. (C) Representative images of engineered neural organoids stained for ZO-1, SOX2, and MAP2 showing multiple ventricular zones (VZs). Yellow dashed lines indicate ventricular zones (VZs). Scale bars, 50 μm. (D) Distribution of healthy, hypoxic, necrotic cells along Dnds (distance to the nearest diffusible surface) in human primary brain tissues, engineered neural organoids (ENOs) at day 60, and conventional neural organoids (CNOs) at day 60. (E) Quantification of Maximum Dnds of the ENOs and the CNOs at days 15, 30, 60, 120, and 180, Maximum Dnds quantified from human brain slides (In vivo) (mean± SEM, Student’s t test, ****p < 0.001, n = 6 from 3 independent experiments for ENOs and CNOs, n = 5 brain slides for primary tissues). White dashed circles indicate the VID scaffolds (panels C).
Figure 2.
Figure 2.. Enhanced diffusion of the medium, oxygen, and signaling molecules.
(A) Top: schematics and bright-field image of the VID scaffold. Bottom: Schematics and overlayed trajectory of 2 μm beads showing the perfusion guided by VID scaffolds, including flow transfer in tubes and perfusion of the surrounding tissues. Scale bar, 200μm. (B) Pimonidazole-based hypoxia staining of the ENOs and the CNOs at days 15, 30, 60, and 180. Scale bar, 200μm. (C) Quantification of hypoxia areas in the ENOs and the CNOs over time (mean± SEM, Student’s t test, ****p < 0.001, n = 6, from 3 independent experiments) (D)Perfusion assay using different-sized dyes (Hoechst, 615Da; CF®488A WGA, 36kDa; CF@594 Con A, 105kDa) to model the tissue penetration of various molecules. Left: schematics and representative images showing dye distribution in the ENOs and the CNOs after 12 hours of perfusion. Scale bar, 50μm. Right: corresponding quantitative percentage of hypoxia areas in the ENOs and the CNOs (mean± SEM, Student’s t test, ****p < 0.001, n = 6 from 3 independent experiments). White dashed circles indicate the VID scaffolds (panels B and D).
Figure 3.
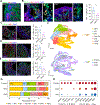
Figure 3.. Reduced stress and sustained neurogenesis.
(A) Representative immunostaining images of the engineered neural organoids (ENOs) and the conventional neural organoids (CNOs) at days 15, 30, 60, and 180 for neural progenitor maker (SOX2), mature neuron marker (MAP2), and apoptosis marker (cleaved caspase-3, or Cas3). Scale bars, 200μm. (B) Immunostaining of the ENOs and the CNOs at days 15, 30, 60, and 180 for proliferating cell marker (ki67) and early-stage neuron marker (Tuj1). Yellow dashed lines indicate ventricular zones (VZs). Scale bar, 50μm. (C) Percentage of neural progenitor cells (SOX2+), proliferating cells (ki67+) in the outer proliferating (non-necrotic) region at days 15, 30, 60, 120, and 180. Percentage of apoptotic area (Cas3+) in the whole organoid over time (mean± SEM, Student’s t test, ***p < 0.005, ****p < 0.001, n = 6, from 3 independent experiments). (D) GO term and kegg pathway analysis of the most affected genes in the neural progenitor cells. Alluvial plots showing the selected gene ontology (GO) terms and kegg pathways comparing neural progenitor cells (NPCs) in the single cell RNA seq data of the ENOs and the CNOs at day 60. The thickness indicates the number of significantly different gene expressions involved in each term. (E) Heatmap of gene expression involved in GO term “Response to ER (endoplasmic reticulum) stress” and “Hypoxia”, kegg pathway term “AMPK pathway” and “Cell cycle” among neural progenitor cells (NPCs) in the ENOs and the CNOs from single-cell RNA seq data. (F) Expression of stress genes including EIF2AK3, CRYAB, GORASP2, and CDKN1A in the ENOs, the CNOs, and the primary human fetal midbrain tissues (primary) from single cell seq RNA seq data. White dashed circles indicate the VID scaffolds (panel A).
Figure 4.
Figure 4.. Enhanced midbrain region-specific differentiation.
(A) Immunostaining of the engineered neural organoids (ENOs) at day 30 for mature neuron marker (MAP2) and proliferating cell marker (ki67). Scale bar, 50 μm. (B) Immunostaining of the ventricular zone (VZ) in the engineered neural organoids (ENOs) and the conventional neural organoids (CNOs) at day 30 for proliferating cell marker (ki67), dopaminergic progenitor marker (FOXA2), and mature neuron marker (MAP2). Scale bar, 50 μm. Yellow dashed lines indicate ventricular zones (VZs). Corresponding quantification of proliferating dopaminergic progenitors (FOXA2+ & ki67+) (mean± SEM, Student’s t test, *p < 0.05, n = 6 from 3 independent experiments). (C) Immunostaining of the engineered neural organoids (ENOs) and the conventional neural organoids (CNOs) at day 30 for dopaminergic progenitor marker (LMX1A) and proliferating cell marker (ki67). Scale bar, 50 μm. Corresponding quantification of proliferating dopaminergic progenitors (LMX1A+ & ki67+) (mean± SEM, Student’s t test, *p < 0.05, n = 6 from 3 independent experiments). (D) Immunostaining of the ENOs and the CNOs at day 60 for dopaminergic progenitor marker (FOXA2) and dopaminergic neuron marker (TH). Scale bar, 50 μm. Corresponding quantification of dopaminergic progenitors (FOXA2+) (mean± SEM, Student’s t test, **p < 0.01, n = 6 from 3 independent experiments). (E) Immunostaining of the ENOs and the CNOs at day 60 for mature neuron marker (MAP2) and dopaminergic neuron marker (TH). Scale bar, 50 μm. Percentage of dopaminergic neurons in ENOs and CNOs at day 60 (mean± SEM, Student’s t test, *p < 0.05, n = 6 from 3 independent experiments). (F) Top: identification of various midbrain-like cell clusters in the integrated dataset. Uniform manifold approximation and projection (UMAP) plots of integrated single-cell RNA-seq dataset using canonical correlation analysis (CCA) method, 60-day ENO (9482 cells), 60-day CNO (8148 cells), and primary embryonic human midbrain (1977 cells). Bottom: UMAP plots showing the intersection of samples in the integrated dataset. Co-clustering of human primary embryonic midbrain and organoid single-cell RNA seq datasets. (G) Ratio of different cell clusters in the ENOs and the CNOs at day 60, and human primary embryonic midbrains. (H) Dot plot showing the expression of midbrain progenitor markers (EN1, LMX1A, FOXA2, and SHH) and dopaminergic neuron markers (TH, CAK2N1, BEX5, NR4A2, and PBX1) among three groups. White dashed circles indicate the VID scaffolds (panels C, D, and E).
Figure 5.
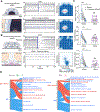
Figure 5.. Improved neural activity and functional networks.
(A) Schematics of measuring neural activity of conventional neural organoid (CNO) on MEA electrodes. A necrotic core with low neural activity was formed in CNOs as the diffusion from the MEA side was limited. Representative raster plots and smoothed activity heatmaps showing the network spiking activities in the CNO at day 90, a low-activity center could be observed in the CNO. Corresponding calculated functional connectivity maps. (B) Schematics of measuring neural activity of engineered neural organoid (ENO) on MEA electrodes. Enhanced diffusion by the VID scaffold could support the viability and function of the ENOs on MEA. Representative raster plots and smoothed activity heatmaps show the network spiking activities in the ENO at day 90, with good activity all over the organoid. Corresponding calculated functional connectivity maps. In the functional connectivity map, the color and thickness of the lines (edges) indicated the correlation level between electrodes, and the size of the nodes showed the number of lines (edges) connected to the corresponding electrode. (C) Quantification of active electrodes, mean firing rate, and network indexes (efficiency, density, and clustering of the functional network) of the ENOs and the CNOs at day 90 (mean± SEM, Student’s t test, *p < 0.05, n = 11 from 3 independent experiments). (D) Representative spikes detected from one channel (with the highest spiking amplitude) of the ENO and the CNO. Solid traces represent the averaged spikes (30 spikes overlayed), and the ranges represent the SEM. (E) Quantification of spiking amplitudes from the ENOs and the CNOs, each point represents the averaged spiking amplitude detected from the electrode with the largest spiking amplitude in an organoid (mean± SEM, Student’s t test, *p < 0.05, n = 8, from 3 independent experiments).
Figure 6.
Figure 6.. Enhanced pharmacological response.
(A) Schematics of drug diffusion in the conventional neural organoid (CNO) on the microelectrode array (MEA) electrodes Representative raster plots and smoothed activity heatmaps of the same CNO before and 20 minutes after 50nM fentanyl treatment. (B) Schematics of drug diffusion in the engineered neural organoid (ENO, same as in Figure 5) on the microelectrode array (MEA) electrodes. Representative raster plots and smoothed activity heatmaps of the same ENO before and 20 minutes after 50nM fentanyl treatment. (C) Quantification of electrical activity changes in response to fentanyl treatment, as indicated by mean firing rate, burst frequency, and active electrodes (mean± SEM, Student’s t test, *p < 0.05, **p < 0.01, ***p < 0.005, n = 11, from 3 independent experiments). (D) GO term analysis of the ENOs treated with 50nM fentanyl for 2 days (ENO + fentanyl) and the ENOs without any treatment (ENO). Alluvial plots show the gene ontology (GO) terms of neurons (Neuron) and astrocytes (Glia) in the ‘ENO’ and ‘ENO + fentanyl’ groups. The thickness indicates the number of significantly different gene expressions involved in each GO term.

Update of

References

    1. Qian X, Song H, and Ming G. -l. (2019). Brain organoids: advances, applications and challenges. Development 146, dev166074. - PMC - PubMed
    1. Lancaster MA, and Knoblich JA (2014). Organogenesis in a dish: modeling development and disease using organoid technologies. Science 345, 1247125. - PubMed
    1. Kelava I, and Lancaster MA (2016). Stem cell models of human brain development. Cell stem cell 18, 736–748. - PubMed
    1. Eichmüller OL, and Knoblich JA (2022). Human cerebral organoids — a new tool for clinical neurology research. Nature Reviews Neurology 18, 661–680. 10.1038/s41582-022-00723-9. - DOI - PMC - PubMed
    1. Lancaster MA, Renner M, Martin C-A, Wenzel D, Bicknell LS, Hurles ME, Homfray T, Penninger JM, Jackson AP, and Knoblich JA (2013). Cerebral organoids model human brain development and microcephaly. Nature 501, 373–379. 10.1038/nature12517. - DOI - PMC - PubMed

LinkOut - more resources