. 2025 Mar 17;13(3):e009239.
doi: 10.1136/jitc-2024-009239.

Cyclin E1 overexpression triggers interferon signaling and is associated with antitumor immunity in breast cancer

Affiliations

Cyclin E1 overexpression triggers interferon signaling and is associated with antitumor immunity in breast cancer

Shibo Yu et al. J Immunother Cancer. .

Abstract

Background: Cyclin E1 overexpression drives oncogenesis in several cancers through deregulation of DNA replication and induction of genomic instability, which may potentially trigger immune signaling via cytoplasmic DNA. However, the effects of cyclin E1 overexpression on tumor immunity and its effects on the response to immune checkpoint inhibitors remain largely unclear.

Methods: Tissue microarrays and clinical outcomes of 398 patients with breast cancer were analyzed to explore the correlation between cyclin E1 expression, patient survival, and immune cell infiltration using immunohistochemistry. Genomic data from publicly available data sets and three clinical trials evaluating immunotherapy were assessed to measure the impact of cyclin E1 expression on the immune cells in the tumor microenvironment and response to immunotherapy in patients with breast cancer. In addition, breast cancer cell lines with inducible cyclin E1 overexpression were employed to analyze the effects of cyclin E1 on inflammatory signaling.

Results: Increased cyclin E1 expression in breast cancer was positively correlated with immune cell infiltration, including T cells, B cells, and natural killer cells, and activation of interferon-related pathways. Importantly, higher cyclin E1 expression or CCNE1 amplification was associated with better response to immunotherapy in three clinical trials. Mechanistically, cyclin E1 overexpression resulted in micronuclei formation and activation of innate immune signaling, resulting in increased immune cell migration.

Conclusions: Our data show that cyclin E1 overexpression associate with antitumor immunity through activation of innate inflammatory signaling and warrants investigation into amplification or overexpression of cyclin E1 in identifying patients with breast cancer eligible for immunotherapy.

Keywords: Breast Cancer; Immunotherapy.


Conflict of interest statement

Competing interests: BvdV reports honoraria received by UMCG for expertise or scientific advisory board/consultancy (on request): Visiopharm, Philips, MSD/Merck, Daiichi-Sankyo/AstraZeneca; Speaker’s fee from Visiopharm, Diaceutics, MSD/Merck. Personal fees from DEKRA. All unrelated to the current manuscript. All other authors declare no competing interests.

Figures
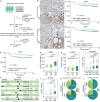
Figure 1
Figure 1. Cyclin E1 correlated with poor clinical outcome in patients with breast cancer. (A) Flow diagram of sample selection (created with BioRender.com). (B) Representative images of cyclin E1 (nuclear) and cyclin E1 (cyto) expression in patients with breast cancer’s TMAs. (C–D) Kaplan-Meier survival analysis of patients with high and low levels of cyclin E1 nuclear (RFS; log-rank test) or cytoplasm (RFS; log-rank test) expression in our TMAs. (E) Kaplan-Meier survival analysis of patients with cyclin E1 cytoplasm and nuclear both high (RFS; log-rank test) expression in our TMAs. (F) Multivariable Cox regression analysis of RFS in our patient TMAs cohort. Data are presented as HR and 95% CI. (G–H) The comparison of cyclin E1 cytoplasm (G) and nuclear (H) expression in different tumor grades. Statistic test: Kruskal-Wallis test with the Dunn’s multiple-comparison test was used for comparisons among groups. (I–J) The comparison of cyclin E1 mRNA expression in different NPI and tumor grades in the METABRIC database. Statistic test: Kruskal-Wallis test with the Dunn’s multiple-comparison test was used for comparisons among groups. (K–L) The percentage of different NPI and tumor grades between patients without or with CCNE1 copy number gain in the METABRIC database. METABRIC, Molecular Taxonomy of Breast Cancer International Consortium; mRNA, messenger RNA; NPI, Nottingham Prognostic Index; OS, overall survival; RFS, relapse-free survival; TIL, tumor infiltrating lymphocyte; TMAs, tissue microarrays; TNBC, triple negative breast cancer; UMCG, University Medical Center Groningen.
Figure 2
Figure 2. Cyclin E1 expression is correlated with immune cell infiltrate in the tumor microenvironment in patients with breast cancer. (A) The comparison of cyclin E1 mRNA expression in different spatial patterns of TILs in TCGA. Statistic test: Kruskal-Wallis test with the Dunn’s multiple-comparison test was used for comparisons among groups. (B) The percentage of different TIL patterns between patients without or with CCNE1 copy number gain in the TCGA database. (C) Box plot showing TIL percentage between patients without or with CCNE1 copy number gain in the TCGA database. Statistic test: Wilcoxon rank-sum test. (D) Representative H&E staining images of breast cancer tissue with different percentages of TILs. (E) Correlation analysis between cyclin E1 expression and TIL levels in different breast cancer subtypes. The size of each circle represents the Spearman’s correlation coefficient, and the color of the circle represents a positive or negative correlation with or without statistical significance. Statistic test: Spearman’s correlation coefficient. (F) Heatmap showing the mean expression of immunomodulatory genes between different replication stress-related oncogene states. (G) The comparison of the richness and diversity score of TCR and BCR repertoire between patients without or with CCNE1 copy number gain in TCGA. Statistic test: Wilcoxon rank-sum test. (H−I) Box plot showing the immune cells’ abundance (MCP-counter) between patients without or with CCNE1 copy number gain in TCGA (H) and METABRIC (I) database. Statistic test: Wilcoxon rank-sum test. (J) Representative images of CD4, CD20, and CD57 expression in patients with breast cancer’s TMAs. (K) Correlation analysis between immune cell markers and cyclin E1 cytoplasm and nuclear in our TMAs. The size of each circle represents the Spearman’s correlation coefficient, and the color of the circle represents a positive or negative correlation with or without statistical significance. Statistic test: Spearman’s correlation coefficient. BCR, B-cell receptor; CTLs, Cytotoxic T Lymphocytes; ER+, estrogen receptor-positive; HER2, human epidermal growth factor receptor-2; METABRIC, Molecular Taxonomy of Breast Cancer International Consortium; MCP-counter, Microenvironment Cell Populations-counter; mRNA, messenger RNA; NK, natural killer; TCGA, The Cancer Genome Atlas; TCR, T-cell receptor; TILs, tumor infiltrating lymphocytes; TMAs, tissue microarrays; WT, wild type.
Figure 3
Figure 3. Cyclin E1 is associated with response to immunotherapy in patients with breast cancer. (A) Overview of two I-SPY2 clinical trials (created with BioRender.com). (B–C) Comparison of Cyclin E1 mRNA expression between no-pCR group and pCR group in the I-SPY2 durvalumab arm (B) and pembrolizumab arm (C). Statistic test: Wilcoxon rank-sum test. (D–E) Comparison of CCNE1 TACNA level between the no-pCR group and pCR group in two I-SPY2 trials. AUC of ROC curves comparing performance of CCNE1 TACNA level, PD-L1, and PD-1 mRNA expression level in two I-SPY2 trials. Statistic test: Wilcoxon rank-sum test. (F) CCNE1 TACNA level across 10 treatment arms in the I-SPY2 trial. Statistic test: Wilcoxon rank-sum test. (G) Comparison of CCNE1 TACNA level between immune and immune+ patients in the I-SPY2 trial. Statistic test: Wilcoxon rank-sum test. (H) Spearman’s correlation analysis between cyclin E1 mRNA, CCNE1 TACNA level, and interferon-related signaling pathways in the I-SPY2 trial. The size of each circle represents the Spearman’s correlation coefficient, and the color of the circle represents a positive or negative correlation with or without statistical significance. Statistic test: Spearman’s correlation coefficient. AUC, area under the curve; mRNA, messenger RNA; pCR, pathologic complete response; PD-1, programmed death 1; PD-L1, programmed death ligand 1; ROC, receiver operating characteristic; RNA-seq, RNA sequencing; TACNA, transcriptional adaptation to copy number alteration profiling.
Figure 4
Figure 4. Cyclin E1 overexpression induced micronuclei and activates an innate immune response. (A) GSEA enrichment results with NES of top enriched biological pathways in the TCGA cohort (black: pathways with statistical significance; green: IFN-related pathways). Statistic test: the NES for the significantly enriched gene sets (FDR<0.05) are presented in the bar plot. (B–C) Enrichment plots for the two significant pathways that are related to IFN in the TCGA cohort. (D) Immunoblots showing the cyclin E1 overexpression in HCC1806 cells. (E) Representative images of HCC1806 cells±doxycycline (1 µg/mL) for 2 days. Cells were stained with anti-cGAS and DAPI. (F) Quantification of cGAS-positive micronuclei in HCC1806 cells as described in (E). At least 30 cells were counted per condition per replicate. Lines and error bars indicate the mean±SEM of 5 independent experiments. Statistic test: unpaired two-tailed t-test. (G) The expression of IFN-related genes was analyzed by RT-qPCR in HCC1806 cells. Cells were treated with doxycycline (1 µg/mL) for 2 days. Lines and error bars indicate the mean±SEM of 3 independent experiments. Statistic test: unpaired two-tailed t-test. (H) Immunoblotting was performed for cyclin E1, STAT1, pSTAT1, and p-IRF3 in HCC1806 cells. (I–J) Typical histogram and quantification of MFI of PD-L1 in HCC1806 cells±doxycycline (1 µg/mL, 4 days)±IFN-γ (100 ng/mL, 24 hours). Lines and error bars indicate the mean±SEM of 4 independent experiments. Statistic test: paired two-tailed t-test. (K) Schematic overview of the transwell assay (created with BioRender.com). (L) Migration of human PBMCs towards tumor cell conditioned media from HCC1806 cells. Lines and error bars indicate the mean±SEM of 3 independent experiments. Statistic test: unpaired two-tailed t-test. cGAS, cyclic GMP-AMP synthase; DAPI, 4′,6-diamidino-2-phenylindole; DOX, doxycycline; FDR, False discovery rate; false discovery rate; GSEA, Gene Set Enrichment Analysis; IFN, interferon; MFI, median fluorescence intensity; NES, normalized enrichment scores; PBMCs, peripheral blood mononuclear cells; PD-L1, programmed death ligand 1; TCGA, The Cancer Genome Atlas.

References

    1. Arnold M, Morgan E, Rumgay H, et al. Current and future burden of breast cancer: Global statistics for 2020 and 2040. Breast. 2022;66:15–23. doi: 10.1016/j.breast.2022.08.010. - DOI - PMC - PubMed
    1. Larkin J, Chiarion-Sileni V, Gonzalez R, et al. Combined Nivolumab and Ipilimumab or Monotherapy in Untreated Melanoma. N Engl J Med. 2015;373:23–34. doi: 10.1056/NEJMoa1504030. - DOI - PMC - PubMed
    1. Doroshow DB, Sanmamed MF, Hastings K, et al. Immunotherapy in Non-Small Cell Lung Cancer: Facts and Hopes. Clin Cancer Res. 2019;25:4592–602. doi: 10.1158/1078-0432.CCR-18-1538. - DOI - PMC - PubMed
    1. Cortes J, Rugo HS, Cescon DW, et al. Pembrolizumab plus Chemotherapy in Advanced Triple-Negative Breast Cancer. N Engl J Med. 2022;387:217–26. doi: 10.1056/NEJMoa2202809. - DOI - PubMed
    1. Chu C, Geng Y, Zhou Y, et al. Cyclin E in normal physiology and disease states. Trends Cell Biol. 2021;31:732–46. doi: 10.1016/j.tcb.2021.05.001. - DOI - PMC - PubMed

LinkOut - more resources