. 2025 Apr 15:310:121125.
doi: 10.1016/j.neuroimage.2025.121125. Epub 2025 Mar 16.

Mesoscale connectivity of the human hippocampus and fimbria revealed by ex vivo diffusion MRI

Affiliations

Mesoscale connectivity of the human hippocampus and fimbria revealed by ex vivo diffusion MRI

Madeline McCrea et al. Neuroimage. .

Abstract

The human hippocampus is essential to cognition and emotional processing. Its function is defined by its connectivity. Although some pathways have been well-established, our knowledge about anterior-posterior connectivity and the distribution of fibers from major fiber bundles remains limited. Mesoscale (250 μm isotropic acquisition, upsampled to 125 μm) resolution MR images of the human temporal lobe afforded a detailed visualization of fiber tracts, including those that related anterior-posterior substructures defined as subregions (head, body, tail) and subfields (cornu ammonis 1-3, dentate gyrus) of the hippocampus. Fifty pathways were dissected between the head and body, highlighting an intricate mesh of connectivity between these two subregions. Along the body subregion, 12 lamellae were identified based on morphology and the presence of interlamellar fibers that appear to connect neighboring lamellae at the edge of the external limb of the granule cell layer (GCL). Translamellar fibers (i.e. longitudinal fibers crossing more than 2 lamellae) were also evident at the edge of the internal limb of the GCL. The dentate gyrus of the body was the main site of connectivity with the fimbria. Unique pathways were dissected within the fimbria that connected the body of the hippocampus with the amygdala and the temporal pole. A topographical segregation within the fimbria was determined by fibers' hippocampal origin, illustrating the importance of mapping the spatial distribution of fibers. Elucidating the detailed structural connectivity of the hippocampus is crucial to develop better diagnostic markers of neurological and psychiatric conditions, as well as to devise novel surgical interventions.

Keywords: Connectome; Diffusion MRI; Fimbria; Hippocampus; Mesoscale; Subfields; Tractography.


Conflict of interest statement

Declaration of competing interest The authors have no personal financial or institutional interest in the results described in this article.

Figures

Fig. 1.
Fig. 1.
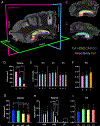
3D visualization and diffusion metrics of the hippocampus and fimbria. A. 3D view of the hippocampus and fimbria within the human temporal lobe, depicting the spatial relationship between the two structures. The fimbria lies along the medial border of the hippocampus body. B. Medial views of the fimbria highlight its medial position in relation to the hippocampus. C. Lateral views show the dentation and wave-like surface of the hippocampus. D. Hippocampal volume was significantly larger than the fimbria (p < 0.001). E. The average scalar indices of the hippocampus were greater than those of the fimbria (p < 0.001, p = 0.014, p < 0.001). F. In contrast, the FA is significantly greater in the fimbria (p < 0.001), reflecting the preponderance of highly-aligned fiber tracts within the fimbria.
Fig. 2.
Fig. 2.
Volume and diffusion measurements of the hippocampal subregions and subfields. A. 3D visualization of the subfields of the hippocampus within the human temporal lobe. B. A medial view of the hippocampus exposes the CA2 and CA3 subfields along the entire hippocampal axis. The DG is also visible ventrally for the body and tail subregions. C. Lateral view of the hippocampal subfields reveals the CA1 and DG subfields. D. The volumes of the head subregions is greater than the body and tail of the hippocampus (p < 0.001). E. Diffusion measures of the head, body, and tail regions revealed no significant difference. F. The tail produced the largest FA value, although the difference is not significant compared to the other subregions. G. Volume of the subfields indicated that the DG and CA1 subfields were equivalent, but both were larger than the CA2 and CA3 subfields. The DG is significantly larger the CA2 (p = 0.048) and CA3 (p = 0.011), and CA1 is significantly larger than CA3 (p = 0.033). H. Breaking down subfields according to subregions revealed that CA3 was largest in the head and then gradually decreased in the body and tail subregion. In contrast, DG and CA1 were largest in the body subregion, hence suggesting a differential importance of these subfields in the different subregions. The subfields did not differ significantly in the head. However, in the body, the DG was larger than CA2 (p = 0.006) and CA3 (p < 0.001). CA1 was larger than CA2 (p = 0.005) and CA3 (p < 0.001), and CA2 was larger than CA3 (p = 0.044). In the tail, CA1 was larger than CA3 (p < 0.01). I. FA was lowest for the DG, but was consistent across all CA subfields.
Fig. 3.
Fig. 3.
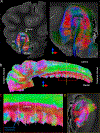
Tractography of the hippocampus. A. Coronal slice of the temporal lobe revealing Schaffer collaterals within the hippocampus proper, as well as other fibers, including connections with the entorhinal cortex. A major advantage of investigating tractography of the hippocampus in situ is there is no damage due to dissections, surgical trauma, or distortions due to sample manipulations. B. Hippocampus-restricted tractography reveals surface dentations of the DG, as well as the wave-like surface along the body-head transition. C. Along the surface dentations of the DG, inter-lamellar fibers are evident, suggesting that these dentations define lamellar structures. D. A coronal slice through the center of such a lamella in the center of the body’s subregion reveals the conventional view of single hippocampal slices’ lamellar connectivity, including cannonical connections, such as Schaeffer collaterals in the CA subfields and Mossy fibers in the DG.
Fig. 4.
Fig. 4.
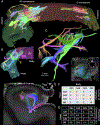
Connectivity between subregions of the hippocampus. A. The connections between the head and body subregions, as well as the body and tail subregions, illustrate individual pathways between these regions. No direct connection between the tail and the head subregion was evident. However, 50 individual pathways were dissected between the head and body subregions. These connections were complex in their spatial locations, as well as how these intertwined. In contrast, the 8 connections between the body and tail were simpler. Some of these were more consistent with translamellar connections based on their location and pattern of connectivity. B. A 3D view of the connections with the DG of the head and body reveals the unique pathways that connect very specific “spots” of the DG with other “spots” or “zones”. Refinements in anatomical terminology are required to better describe “what” these pathways connect. C. The DG-based pathways relate very narrow fibers tracts orginiating/terminating in a specific area, but at the other end were distributing more widely. At the core of the DG, a loop of connectivity is apparent around the GCL. D. A coronal view with the DG indicates that most of these pathways originate in the stratum moleculare (SM) of the DG rather than the hilus. E. A coronal slice at the border of the head/body subregions illustrated how the DG is the main site of connectivity between both subregions. F. Quantification of the number of pathways between subfields of the head and body revealed that 18 unique tracts connected the DG between the head and body subregion, while 13 were identified between the DG in the head and CA2 in the body. G. The proportional connectivity was calculated and indicates that the connectivity between the DG head to body tracts only constitutes 11.2 % of the total fibers between the head and body. Connectivity between the DG in the head and CA2 in the body comprises the largest amount of fibers. Pathways between the DG in the head and body were hence smaller and more focal in nature, while the smaller number of pathways between the DG in the head and CA2 in the body have more fibers and more distributed.
Fig. 5.
Fig. 5.
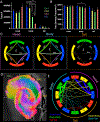
Quantification of subfield connectivity across hippocampal subregions. A. The fiber tract number within the subfields in each subregion (i.e. regional subfields) reveals a substantial amount of fibers within the head and body subregions, whereas the tail has significantly less fibers. In the body, the subfields show significant differences in tract number, largely reflective of the size of the subfields (DG>CA2, p < 0.001; DG>CA3, p < 0.001; CA1>CA2, p = 0.004; CA1>CA3, p < 0.001; CA2>CA3, p = 0.037). B. The number of fiber tracts is dependent on the number of seeds and the volume of a structure. To better compare these ROIs, a calculation of tract density provides deeper insights into similarities and differences between these anatomical regions. The subfields have a similar tract density within the head, while in the body and tail, the DG has the largest tract density. In the body, the CA regions have similar tract densities, but CA3 has the lowest track density (DG>CA3, p < 0.01. In contrast in the tail, CA3 exhibits a larger tract density than both CA1 and CA2. C. Circular plots of the connections between subfields within the head, body, and tail graphically illustrate regional connectivity. The thickness of the lines indicates the number of tracts connecting the two ROIs, whereas line color reflects a mixture of connected ROIs. A clear shift in subfield connectivity between subregions is evident. In the head, the DG-CA3 connectivity is highest, but in the body and tail this is reduced considerably. In contrast, DG-CA1 is reduced in the head, but is high in the body and tail subregion. D. A visual representation of the connections between subfields in the body subregion exemplifies the extensive number of streamlines involved in hippocampal connectivity. However, from this visual impression of a “hippocampal slice” it is difficult to determine relative changes in connectivity. E. A graphical summary of the connectome of the hippocampus provides a clear overview of how different subfields within subregions are connected with each other. Connectivity within each subregion is higher than between subregions. The head-body connections are strongest, whereas the tail-body connections are weaker and head-tail connections are non-existant (For interpretation of the references to color in this figure legend, the reader is referred to the web version of this article.).
Fig. 6.
Fig. 6.
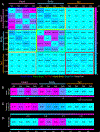
Intrahippocampal network connectivity analysis. A. Connectivity matrix of the regional subfields of the hippocampus indicates the average number (n = 16 subjects) of fiber tracts (color-scale). B. Node strength of the regional subfields of the hippocampus. The node strength calculates the normalized number of connections with neighboring ROIs. Node strength here was highest in the DG in the head and body, followed by CA2 in the head and body. This coincides with the connectivity matrix, as the strongest connections tend to involve the DG and/or CA2. C. Clustering coefficient of the regional subfields. The clustering coefficient is highest in the head, which indicates that the head was the most interconnected region. D. The betweenness of the regional subfields. The betweenness is highest in the body of the hippocampus. The high betweenness of the body indicates that it is connected to both the head and tail, while the head and tail are not directly connected to each other. (For interpretation of the references to color in this figure legend, the reader is referred to the web version of this article.).
Fig. 7.
Fig. 7.
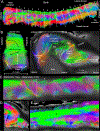
Lamellar Organization of the hippocampus. A. Tractography of the hippocampus divided into lamellae. 12 distinct lamellae were identified within the body of the hippocampus, which displays a simpler organization when compared to that of the head. B. Each lamella is around 1.4 mm. Within the lamella, some fibers align coronally with the DG. Angulated fibers connect neighboring lamella. Horizontal fibers run longitudinally along the anterior-posterior axis. The coronal view within a lamella shows the canonical pathways within the hippocampus (e.g. perforant path), as well as intra- and interlamellar fibers. C. The DG, specifically the GCL, is a major landmark important for the interlamellar fibers. D. The internal and external limbs of the GCL define the locations of inter- (1.) and trans-lamellar connections (2.). E. A longtitudinal cut shows that the fibers located at the external limb tend to be shorter (1.), thus limited to neighboring lamella, while those located at the internal limb (2.) extend beyond neighboring lamella.
Fig. 8.
Fig. 8.
Intra-lamellar connectivity of the hippocampus. A. A coronal slice of the hippocampus depicting intra-lamellar connectivity. The pink fibers from the GCL to the CA3 depict Mossy fibers, while the dashed blue line represents Schaeffer collaterals. B. Hippocampus proper (i.e. CA) connectivity (color-coded for directionality) illustrates the distribution of CA1-CA2 fibers, those connecting CA1 and CA3 through the SM/SR, as well as Schaeffer collaterals perpendicular to the PCL. C. Connectivity of the DG highlighted the complex connectivity of this central region with the overlying CA subfields. D. Dissection and color-coding of individual pathways reveals distinct connectivity between CA2 and the SM of the DG, whereas within the hilus a separation of Mossy fibers from connections between the GCL with the alveus and the fimbria can be oberseved. E. Within the DG, a pathway along the SM to the tip of the internal limb appears to connect to the trans-lamellar pathway, whereas another pathway from the GCL passes through the hilus along the external limb of the GCL to connect to inter-lamellar connections. F. A color-coded directional connectivity view of the fimbria-CA3-DG area illustrated how these pathways intersect and feed into the fimbria. (For interpretation of the references to color in this figure legend, the reader is referred to the web version of this article.).
Fig. 9.
Fig. 9.
Fimbria-hippocampus connectivity. A. An axial slice of the temporal lobe, depicting the connections from the fimbria to the hippocampus. The fimbria displays an aligned bundle of tracts, which turn transversely to the hippocampus. The majority of tracts are associated with the DG, especially the DG within the body. B. 3D view of the connections between the fimbria and hippocampus with and without the ROIs visible. C. The connections between the hippocampus and fimbria displayed with the cluster color indicating the region of the hippocampus to which the fibers are connected. D. Circle graph summarizing the connectivity between the fimbria and the hippocampal subfields within each subregion illustrates that the DG of the body is the main site of connectivity for the fimbria (38 % of all fibers). Quantitatively the tail subregion has the lowest amount of fibers. (For interpretation of the references to color in this figure legend, the reader is referred to the web version of this article.).
Fig. 10.
Fig. 10.
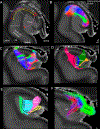
Fimbria-hippocampal regional subfield conncetivity. A. A virtual dissection of the fimbria fiber tracts associated with the body of the hippocampus with the DG and CA3 ROIs in the body visible. Three spatially distributed clusters (purple, orange, and light blue) were seen terminating in the DG and CA3, while two narrow tracts (red and green) extended past the hippocampus body. B. Two narrow pathways divide the fimbria along an oblique axis. The red narrow tract extends through the fimbria beyond the head region of the hippocampus, while the green tract extends towards the tail. Although both tracts are associated with the ventral portion of the body subregion, they are spatially segregated. Both tracts follow the curvature of the fimbria. C. Surrounding these two narrow tracts, more spatially dispersed tracts are evident. Two of the three clusters (orange and purple) were restricted to the DG, while the third cluster (light blue) connects to CA3. (For interpretation of the references to color in this figure legend, the reader is referred to the web version of this article.).
Fig. 11.
Fig. 11.
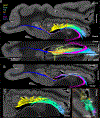
Overview of the connectivity of the fimbria. A. Tractography of the fimbria reveals a robust set of fiber tracts that contained several distinct pathways. The head, body and tail contributed separate sets of fibers to the fimbria, as revealed by selecting and color-coding fibers based on clustering. B. By dissecting separate fiber bundles, specific pathways connecting the hippocampus with other brain regions could be identified. One pathway connected the body subregion with the temporal pole, whereas another unique set of fibers connected the body/tail subregions with the amygdala. In the other direction, subsets of fibers could be differentiated as forming part of the crux of the fornix, but adjacent fibers took a different direction at the level of the tail. C. Fibers from the head subregion converged and emerged as the fimbria. Along the head-body transition, fibers fed into the elongated fimbria along the body of the hippocampus. In the middle of the body, a separation of fimbria fibers was evident. Fibers associated with the anterior (head) hippocampus passed towards the crux of the fornix, whereas posterior (tail) aspects veered through the fimbria towards the anterior part of the temporal lobe. D. A coronal slice through the fimbria at the level of the body indicated that there is a topological organization of fibers from the hippocampus. Fibers from the head were located superiorly to those associated with the body. Fibers from the tail and those contributing to the crux were located more ventrally. (For interpretation of the references to color in this figure legend, the reader is referred to the web version of this article.).

References

    1. Abraham H, Vincze A, Jewgenow I, Veszpremi B, Kravjak A, Gomori E, Seress L, 2010. Myelination in the human hippocampal formation from midgestation to adulthood. Int. J. Dev. Neurosci. 28, 401–410. - PubMed
    1. Adelmann G, Deller T, Frotscher M, 1996. Organization of identified fiber tracts in the rat fimbria-fornix: an anterograde tracing and electron microscopic study. Anat. Embryol. 193, 481–493. - PubMed
    1. Adler DH, Pluta J, Kadivar S, Craige C, Gee JC, Avants BB, Yushkevich PA, 2014. Histology-derived volumetric annotation of the human hippocampal subfields in postmortem MRI. Neuroimage 84, 505–523. - PMC - PubMed
    1. Adler DH, Wisse LEM, Ittyerah R, Pluta JB, Ding SL, Xie L, Wang J, Kadivar S, Robinson JL, Schuck T, Trojanowski JQ, Grossman M, Detre JA, Elliott MA, Toledo JB, Liu W, Pickup S, Miller MI, Das SR, Wolk DA, Yushkevich PA, 2018. Characterizing the human hippocampus in aging and Alzheimer’s disease using a computational atlas derived from ex vivo MRI and histology. Proc. Natl. Acad. Sci. USA 115, 4252–4257. - PMC - PubMed
    1. Amaral DG, Witter MP, 1989. The three-dimensional organization of the hippocampal formation: a review of anatomical data. Neuroscience 31, 571–591. - PubMed

LinkOut - more resources