. 2025 Mar 27;68(6):6534-6557.
doi: 10.1021/acs.jmedchem.4c03101. Epub 2025 Mar 18.

From DNA-Encoded Library Screening to AM-9747: An MTA-Cooperative PRMT5 Inhibitor with Potent Oral In Vivo Efficacy

Affiliations

From DNA-Encoded Library Screening to AM-9747: An MTA-Cooperative PRMT5 Inhibitor with Potent Oral In Vivo Efficacy

Ian Sarvary et al. J Med Chem. .

Abstract

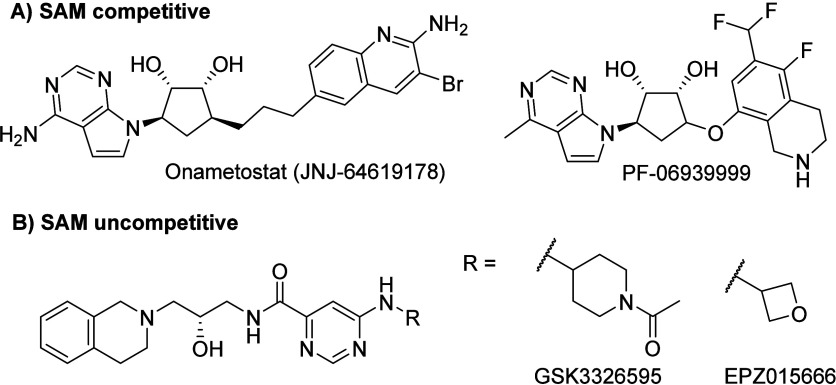
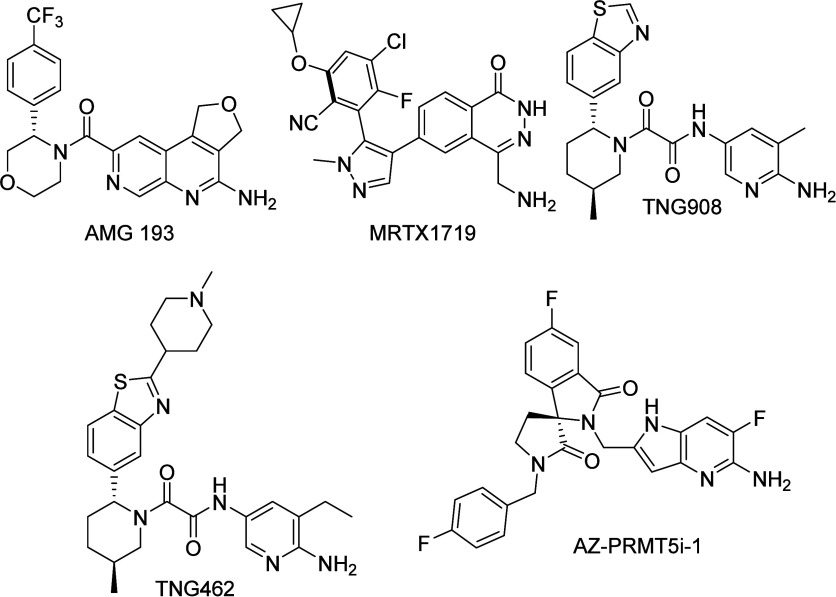
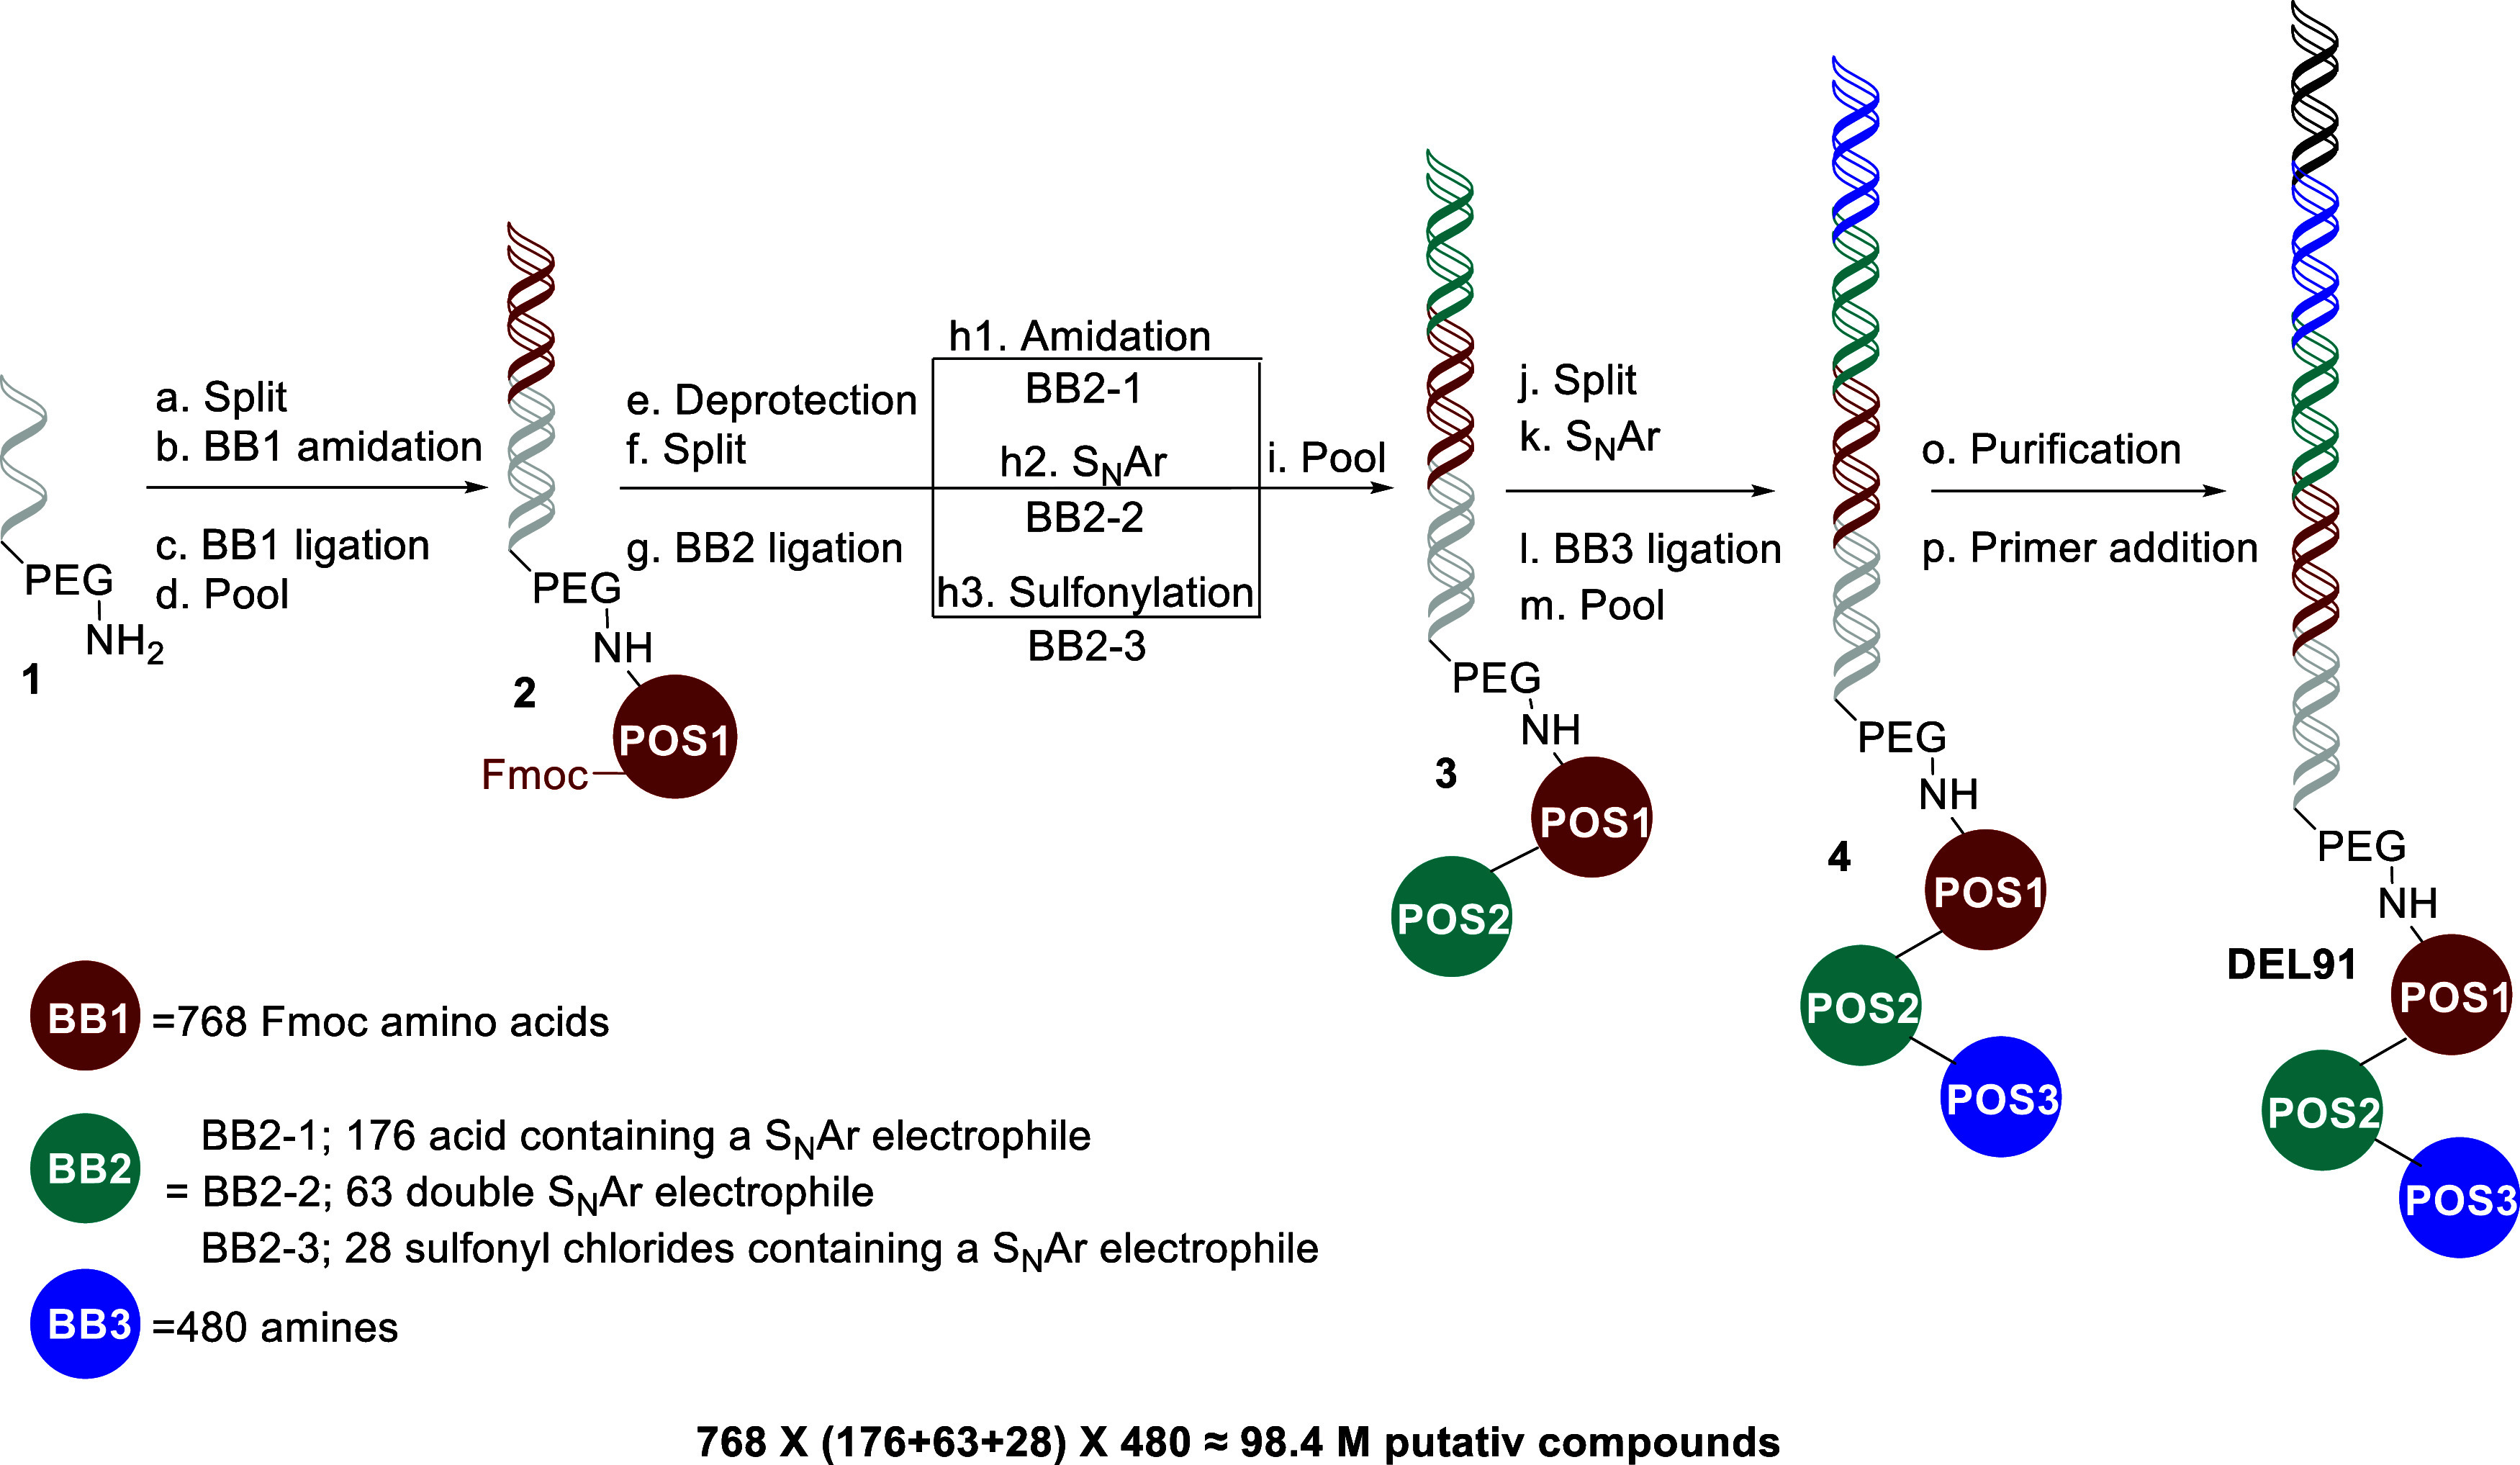
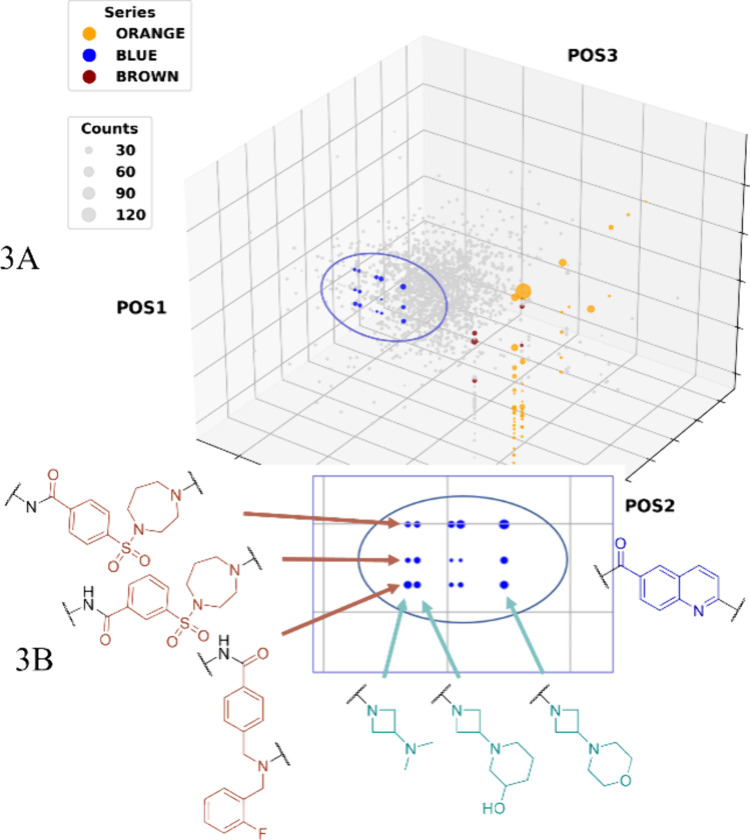
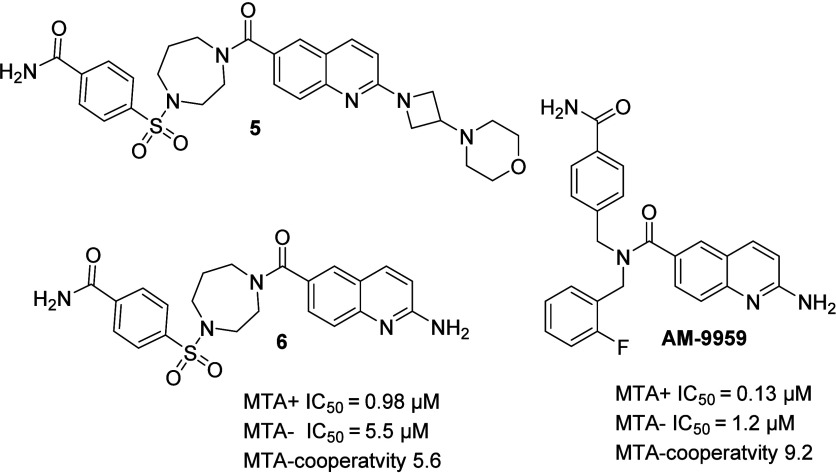
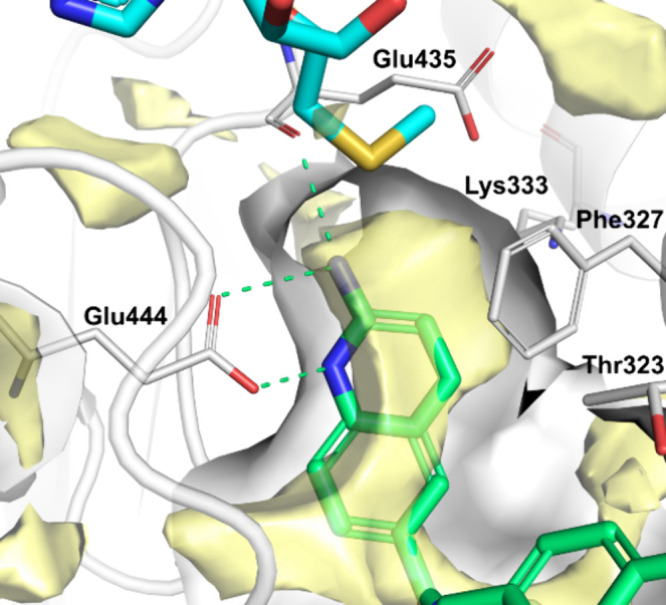
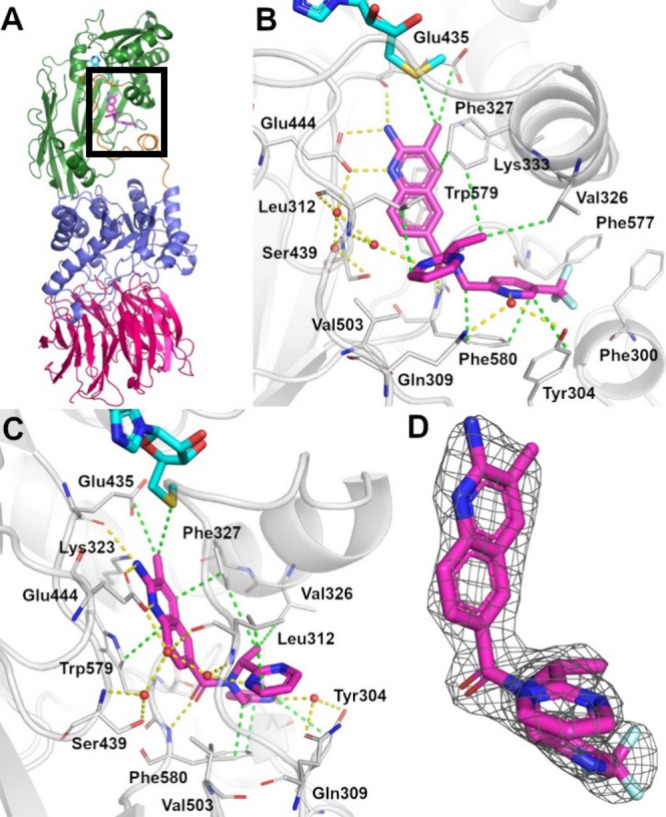
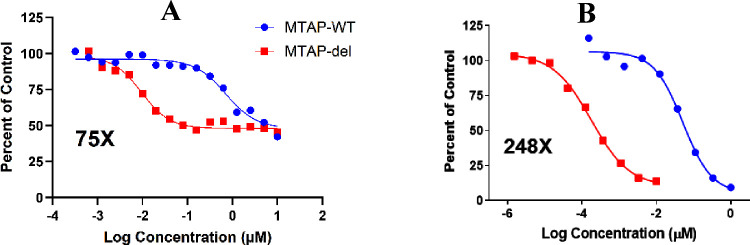
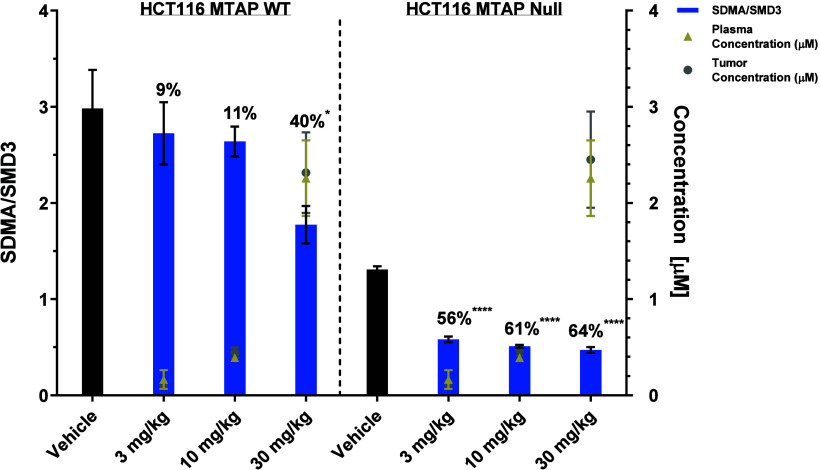
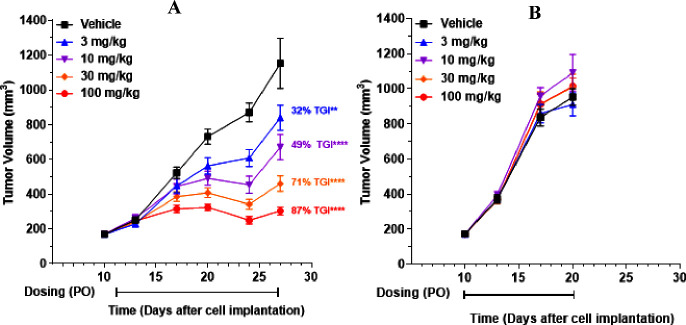
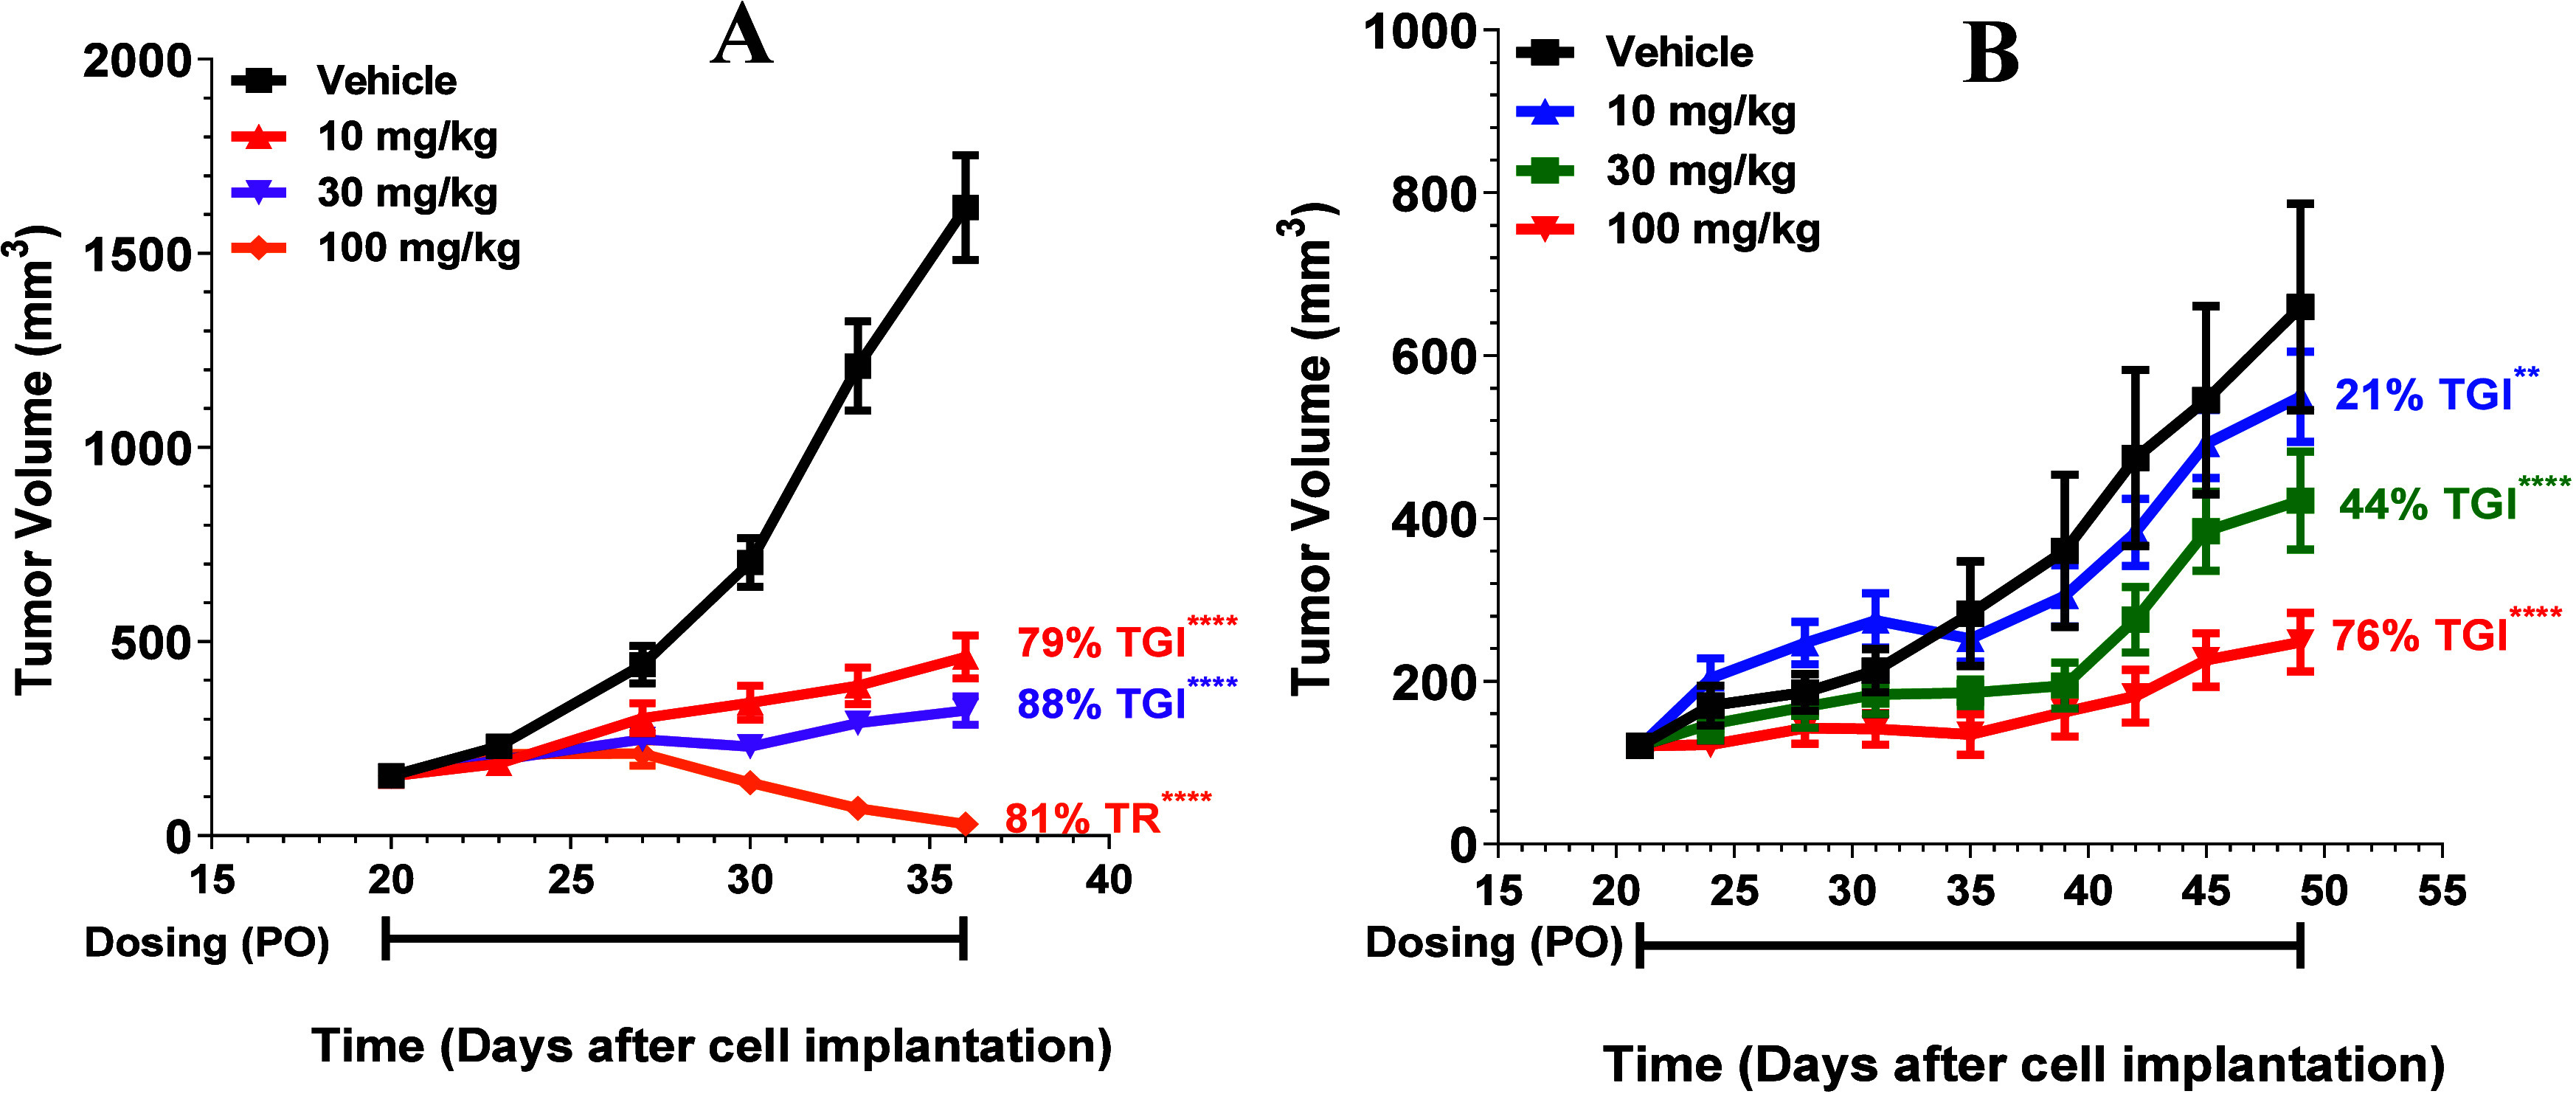
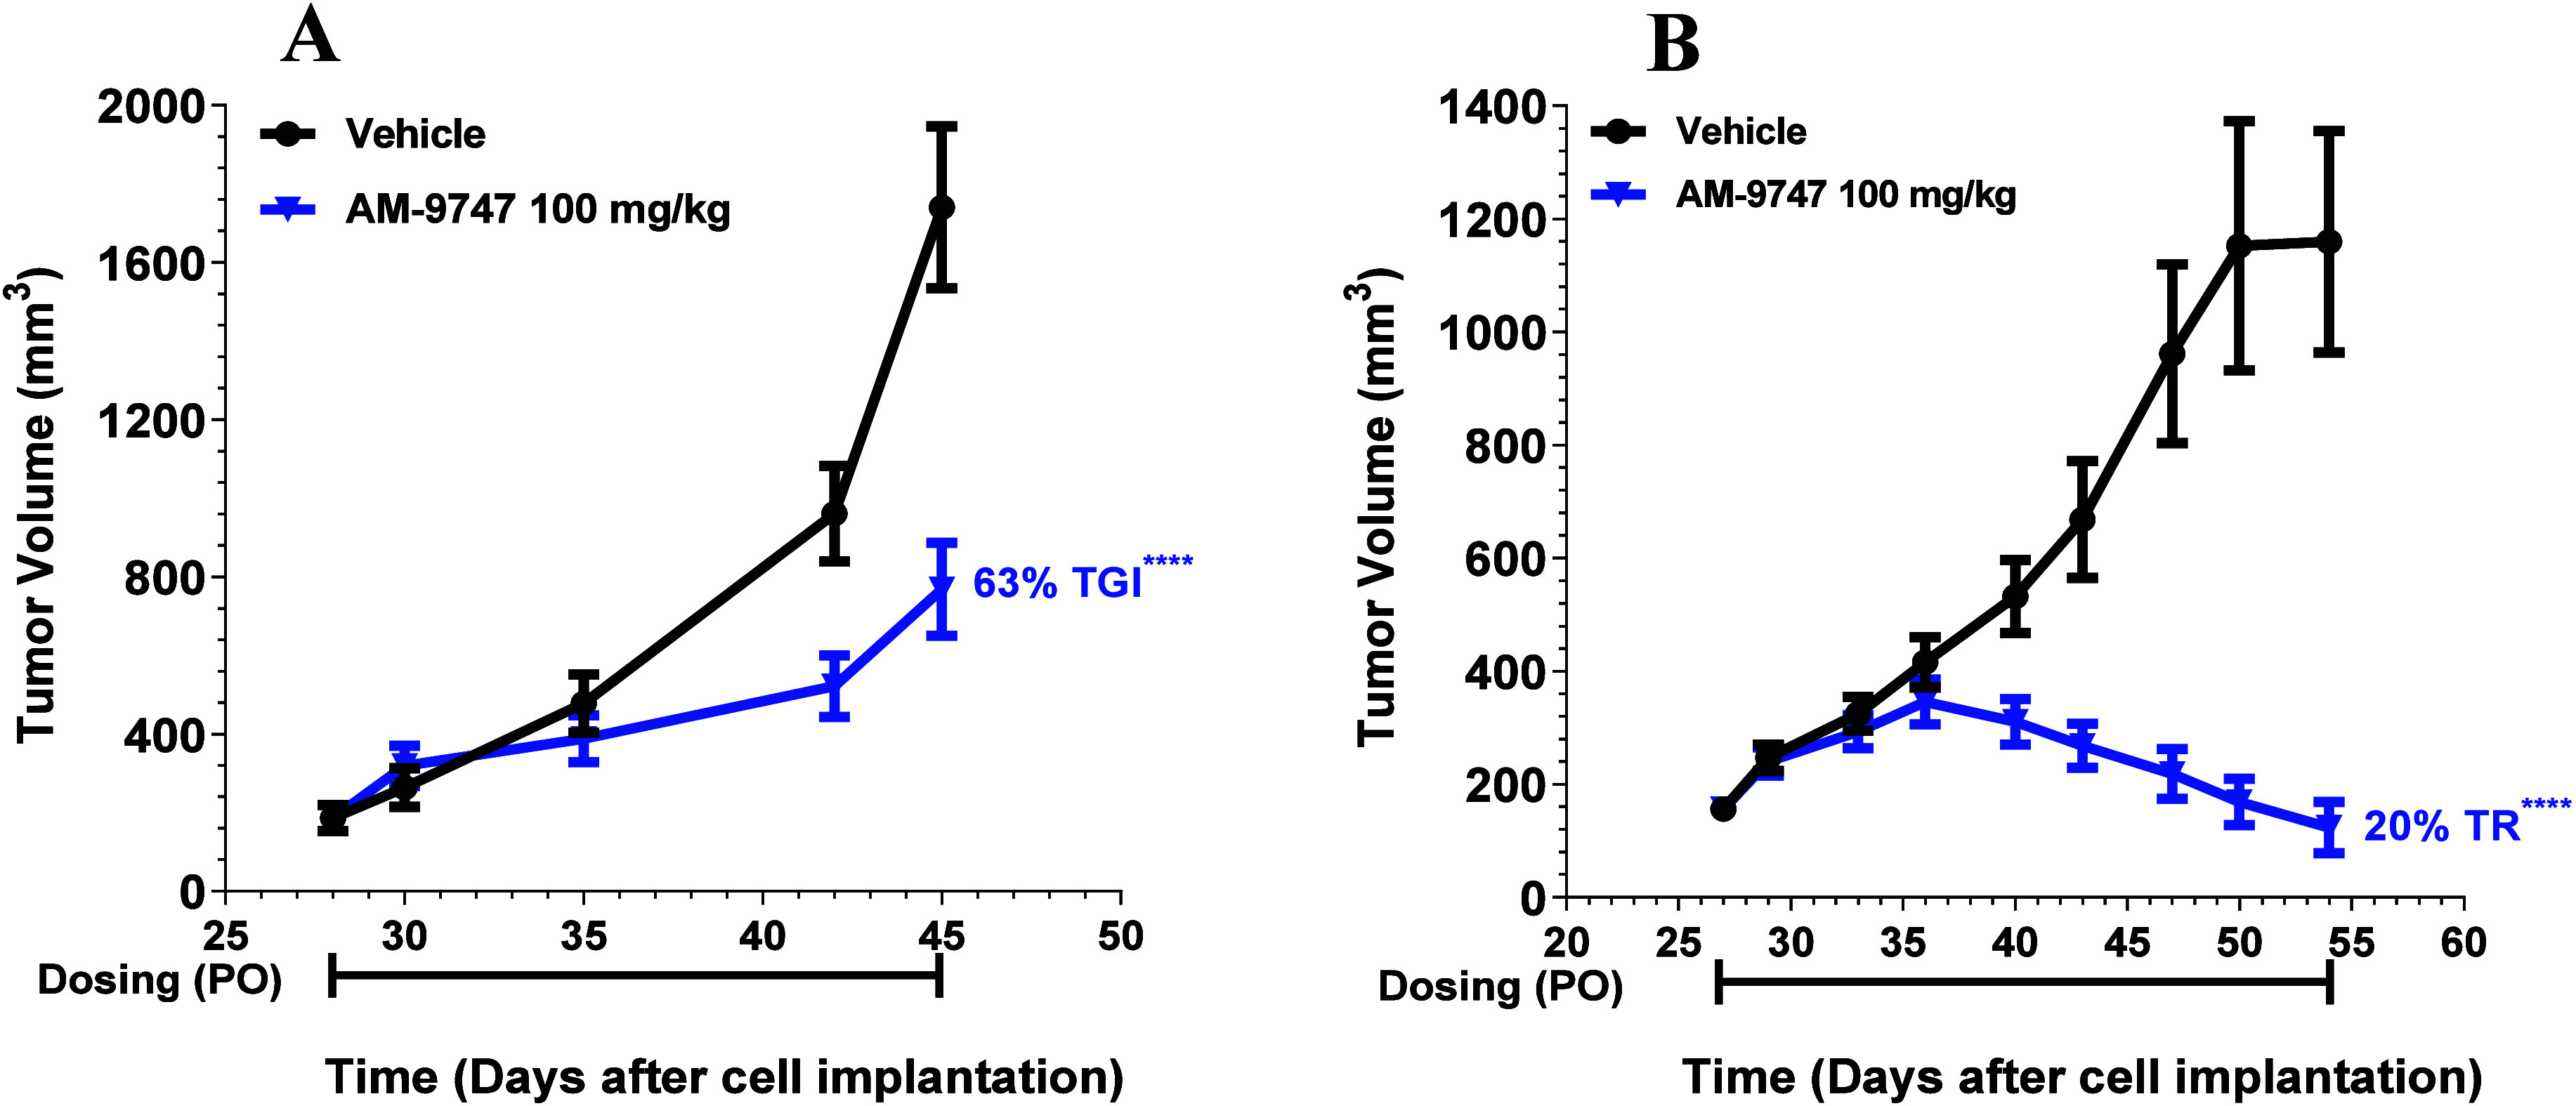
Inhibition of the methyltransferase enzyme PRMT5 by MTA accumulation is a vulnerability of MTAP-deleted cancers. Herein, we report the discovery and optimization of a quinolin-2-amine DEL hit that cooperatively binds PRMT5:MEP50 and MTA to generate a catalytically inhibited ternary complex. X-ray crystallography confirms quinolin-2-amine binding of PRMT5 glutamate-444, while simultaneously exhibiting a hydrophobic interaction with MTA. Lead optimization produced AM-9747, which selectively inhibits PRMT5-directed symmetric dimethylation of arginine residues of proteins, leading to a potent reduction of cell viability in MTAP-del cells compared to MTAP-WT cells. Once-daily oral dosing of AM-9747 in mouse xenografts is well tolerated, displaying a robust and dose-dependent inhibition of symmetric dimethylation of arginine in MTAP-del tumor-xenografts and significant concomitant tumor growth inhibition without any significant effect on MTAP-WT tumor xenografts.


Conflict of interest statement

The authors declare the following competing financial interest(s): All authors were employed with Amgen Inc when the research was conducted.

Figures

Figure 1
Figure 1
Compound structures of first generation PRMT5 inhibitors. (A) SAM competitive inhibitors Onametostat (JNJ-64619178) and PF-06939999. (B) SAM uncompetitive PRMT5 inhibitors GSK3326595 and EPZ015666.
Figure 2
Figure 2
Structures of the MTA-cooperative PRMT5 inhibitors currently in clinical trials AMG 193, MRTX1719, TNG908, and TNG462. Additionally, AZ-PRMT5i-1 is shown as it is a close analogue to AZD-3470, which is also in clinical trials.
Scheme 1
Scheme 1. Production of DEL91
Reagents and conditions: (a) split into 768 wells; (b) BB1, DMTMM, water/DMSO, pH 8 (Na-phosphate buffer), RT, overnight; (c) BB1 DNA-tag, T4 DNA ligase, pH 7.5 (HEPES buffer), 37 °C to RT, inactivation at 80 °C; (d) the 768 wells were pooled; (e) piperidine, H2O, DMF, RT; (f) split into 262 wells; (g) BB2 DNA-tag, ligase, HEPES buffer, 37 °C to RT, inactivation at 80 °C; (h1) BB2-1, DMT-MM, water/DMSO, pH 8 (Na-phosphate buffer); (h2) BB2-2, water/DMSO, pH 8 (Na-phosphate buffer), 75 °C overnight; (h3) BB2-3 water/THF, pH 9 (borate buffer), 30 °C overnight; (i) the 267 wells were pooled; (j) split into 480 wells; (k) BB3, water/DMSO, pH 8 (Na-phosphate buffer), 80 °C overnight; (l) BB3 DNA-tag, ligase, pH 7.5 (HEPES buffer), 37 °C to RT, inactivation at 80 °C; (m) the 480 wells were pooled; (o) gel electrophoresis; (p) DEL91 specific primer extension.
Figure 3
Figure 3
(A) DEL91 PRMT5:MTA affinity selection output represented as a 3D scatterplot, with the BBs of the structures represented on the x, y, and z axis, and the size of the circle representing the counts. Background displayed in light gray and three series ORANGE, BROWN, and BLUE represented in their respective colors and the BLUE series encircled. (B) Transformation of the 3D to a 2D plot by locking POS2. POS1 represented on the y axis and POS3 on the x axis. The preliminary ligand structures of the BLUE series with the two POS1-subseries in brown (diazepane-sulfonyl-phenyl and the substituted dibenzyl), the POS2 locked as the blue structure, and the POS3 in green, outlining the DEL-SAFIR.
Figure 4
Figure 4
Structure of the preliminary MTA cooperative PRMT5 ligand 5 and the corresponding validated MTA-cooperative inhibitor 6 and the substituted dibenzyl subseries AM-9959. MDCKII-MDR1 and -BCRP permeability were performed according to Method B.
Figure 5
Figure 5
Starting point coordinates were obtained from 5FA5 in PDB. Docking of 7 (green) in the binding site of PRMT5 with MTA (cyan), PRMT5 is depicted as ribbons with key residues of the binding site represented as sticks and labeled. The binding-site internal surface is light gray, and favorable energy grid points for hydrophobic interactions are rendered as yellow surfaces. Main Q2A polar interactions are shown as green dashed lines. NB The yellow surface, displaying favorable points for hydrophobic interactions, influences the color of the aniline nitrogen, rendering it gray instead of blue.
Figure 6
Figure 6
Crystallographic complex of AM-9747 and MEP50:PRMT5 with MTA, PDB ID: 9MRE. (A) Proteins, MEP50 and PRMT5, have their secondary structure represented and are color-coded for MEP50 (warm pink), PRMT5 catalytic domain (green), and the TIM barrel domain (violet), and the loop linking these two domains (orange). The ligands, MTA (cyan) and for AM-9747 (magenta), are represented as sticks. (B,C) Coordinates of the crystallographic structure are represented to reveal the binding mode details of AM-9747. The secondary structure of the protein is depicted and colored gray. Residues in proximity of the ligand are drawn as sticks with gray carbon atoms. AM-9747 and MTA are also in stick representation, and carbon atoms are colored magenta and cyan, respectively. Polar interactions are depicted as yellow dashed lines and nonpolar interaction are in green dashed lines. (D) AM-9747 is depicted as sticks with magenta carbon atoms, and the 2Fo-Fc electron density map for the ligand is also shown as mesh at 2.0 RMSD, clearly depicting the R-enantiomer.
Figure 7
Figure 7
(A) AM-9747 viability in HCT116 cellular assay (blue circles, MTAP-WT; red squares MTAP-del). Viability was measured by a CellTiter-Glo assay, and cellular MTA-selectivity was determined as (HCT116-WT IC50/MTAP-del IC50). (B) HCT116-WT and MTAP-del global SDMA levels were assessed by an in-cell imaging assay after 3 days of treatment with AM-9747.
Figure 8
Figure 8
AMG 193 inhibits the growth of MTAP-deleted tumors in vivo. (A) SDMA ELISA analysis of HCT116 MTAP WT and MTAP-deleted bilateral tumors. Mice were administered a total of 4 doses, and tumors were collected 4 h after the last dose. Percentage of inhibition reported relative to the matched vehicle. AM-9747 was quantified by using LC-SRM MS methods for both plasma and tumor homogenate samples. Data represent mean ± SEM, n = 5 for each group. Statistical analysis by one-way ANOVA with Dunnett comparison to control; *P = 0.05, ****P < 0.0001.
Figure 9
Figure 9
Mouse xenograft efficacy model employing female Athymic nude mice implanted with either HCT116 (A) MTAP-del or (B) MTAP-WT tumors. Vehicle and AM-9747 were administered a PO QD for the duration of the study. Percentage of inhibition is reported relative to vehicle. Data represents group means ± SEM, n = 10. STATS: P values were determined by Linear Mixed-Effects Model with Dunnett’s comparison to control. (A) **p < 0.01, ****p < 0.0001. (B) p = NS.
Figure 10
Figure 10
(A) CB17 SCID mice were implanted with DOHH-2 or (B) BxPC-3 tumors. Vehicle and AM-9747 were administered PO QD for the duration of the study. Data represent group means ± SEM, n = 10. STATS: P values were determined by linear mixed-effects model with a Dunnett’s comparison to control; **p < 0.01, ****p < 0.0001.
Figure 11
Figure 11
(A) On day 28, female NOD/SCID mice bearing PA5415 (pancreatic tumors) were sorted into two groups, and dosing was initiated. Vehicle and AM-9747 were administered PO QD for 18 days. Plotted data represent group means ± SEM, n = 10 for each group. (B) On day 27, female NOD/SCID mice bearing ES11082 (esophageal tumors) were sorted into two groups, and dosing was initiated. Vehicle and AM-9747 were administered PO QD for 28 days. Plotted data represent group means ± SEM, n = 10 for each group. STATS: P values were determined by linear mixed-effects model with a Dunnett’s comparison to control; ****p < 0.0001.
Scheme 2
Scheme 2. Synthesis of 6
Reaction conditions: (a) DIPEA, DCM, RT; (b) TFA, DCM, RT; (c) 2-aminoquinoline-6-carboxylic acid, EDC, HOAt, DIPEA, DMF, RT.
Scheme 3
Scheme 3. General Synthesis of the Compounds
Reagents and conditions: (a) reductive amination (a1) NaCNBH3, MeOH; (a2) Na(OAc)3BH, DCM, HOAc; (b); amide coupling (b1) EDC·HCl, HOAt, DIPEA, DMF; (b2) HATU, DMF, TEA, or DIPEA; (b3) PyBroP, DMAc or DMF, TEA, or DIPEA. NA= not applicable.
Scheme 4
Scheme 4. Synthesis of 4-Me-Q2A Acid
Reaction conditions: (a) (2,4-dimethoxyphenyl)methanamine, DIPEA, DMSO, 80–100 °C; (b) CO, MeOH, DIPEA, Pd(OAc)2, xantphos, DMF, 80 °C; (c) LiOH, THF, MeOH, H2O; (d) TFA, DMSO, 50 °C.
Scheme 5
Scheme 5. Synthesis of Q2A Acid S4-4 via the tBuOK-Mediated Friedländer Q2A Synthesis
Reaction conditions: (a) propionitrile, tBuOK, DMSO, 50 °C; (b) CO, MeOH, DIPEA, Pd(OAc)2, xantphos, DMF, 80 °C; or dppf, Pd(OAc)2, CO, MeOH, DMSO, 80 °C; (c) LiOH hydrolysis, RT.
Scheme 6
Scheme 6. Synthesis of Q2A Acids S4-3 and S4-5 via the tBuOK-Mediated Friedländer Q2A Synthesis
Reaction conditions: (a) propionitrile, tBuOK, DMSO, 50 °C.

Similar articles

Cited by

  • MTA-cooperative PRMT5 inhibitors from cofactor-directed DNA-encoded library screens.
    Andersson J, Cowland S, Vestergaard M, Yang Y, Liu S, Fang X, Mukund S, Ghimire-Rijal S, Carter C, Chung G, Jacso T, Sarvary I, Hughes PE, Gouliaev A, Payton M, Belmontes B, Caenepeel S, Franch T, Glad S, Husemoen B, Nielsen SJ. Andersson J, et al. Proc Natl Acad Sci U S A. 2025 May 20;122(20):e2425052122. doi: 10.1073/pnas.2425052122. Epub 2025 May 16. Proc Natl Acad Sci U S A. 2025. PMID: 40377999 Free PMC article.

References

    1. Wu Q.; Schapira M.; Arrowsmith C. H.; Barsyte-Lovejoy D. Protein arginine methylation: from enigmatic functions to therapeutic targeting. Nat. Rev. Drug Discov 2021, 20 (7), 509–530. 10.1038/s41573-021-00159-8. - DOI - PubMed
    1. Peng C.; Wong C. C. The story of protein arginine methylation: characterization, regulation, and function. Expert Rev. Proteomics 2017, 14 (2), 157–170. 10.1080/14789450.2017.1275573. - DOI - PubMed
    1. Fuhrmann J.; Clancy K. W.; Thompson P. R. Chemical biology of protein arginine modifications in epigenetic regulation. Chem. Rev. 2015, 115 (11), 5413–5461. 10.1021/acs.chemrev.5b00003. - DOI - PMC - PubMed
    1. Blanc R. S.; Richard S. Arginine Methylation: The Coming of Age. Mol. Cell 2017, 65 (1), 8–24. 10.1016/j.molcel.2016.11.003. - DOI - PubMed
    1. Guccione E.; Richard S. The regulation, functions and clinical relevance of arginine methylation. Nat. Rev. Mol. Cell Biol. 2019, 20 (10), 642–657. 10.1038/s41580-019-0155-x. - DOI - PubMed

LinkOut - more resources