. 2025 Jun;68(6):1261-1278.
doi: 10.1007/s00125-025-06397-4. Epub 2025 Mar 18.

Comprehensive sequencing profile and functional analysis of IsomiRs in human pancreatic islets and beta cells

Affiliations

Comprehensive sequencing profile and functional analysis of IsomiRs in human pancreatic islets and beta cells

Stefano Auddino et al. Diabetologia. 2025 Jun.

Abstract

Aims/hypothesis: MiRNAs regulate gene expression, influencing beta cell function and pathways. Isoforms of miRNA (isomiRs), sequence variants of miRNAs with post-transcriptional modifications, exhibit cell-type-specific expression and functions. Despite their biological significance, a comprehensive isomiR profile in human pancreatic islets and beta cells remains unexplored. This study aims to profile isomiR expression in four beta cell sources: (1) laser capture microdissected human islets (LCM-HI); (2) collagenase-isolated human islets (CI-HI); (3) sorted beta cells; and (4) the EndoC-βH1 beta cell line, and to investigate their potential role in beta cell function.

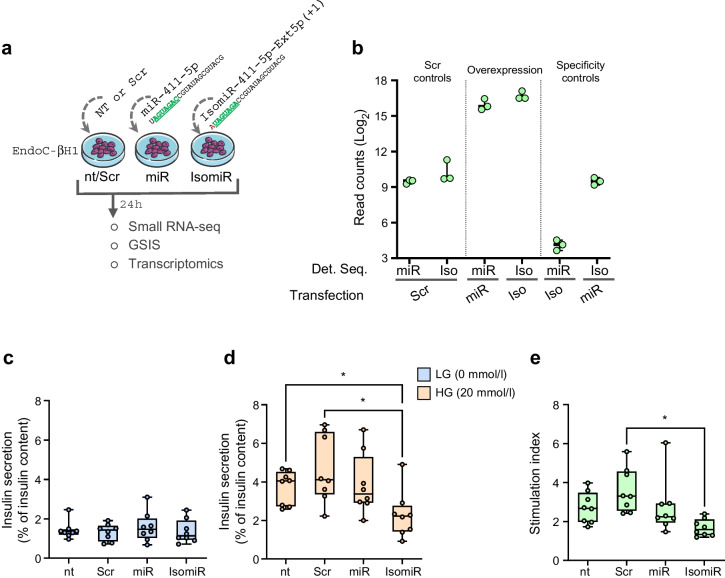
Methods: Small RNA-seq and/or small RNA dataset analysis was conducted on human pancreatic islets and beta cells. Data were processed using the sRNAbench bioinformatics pipeline to classify isomiRs based on sequence variations. A beta cell-specific isomiR signature was identified via cross-validation across datasets. Correlations between LCM-HI isomiR expression and in vivo clinical parameters were analysed using regression models. Functional validation of isomiR-411-5p-Ext5p(+1) was performed via overexpression in EndoC-βH1 cells and CI-HI, followed by glucose-stimulated insulin secretion (GSIS) assays and/or transcriptomic analysis.

Results: IsomiRs constituted 59.2 ± 1.9% (LCM-HI), 59.6 ± 2.4% (CI-HI), 42.3 ± 7.2% (sorted beta cells) and 43.8 ± 1.2% (EndoC-βH1) of total miRNA reads (data represented as mean ± SD), with 3' end trimming (Trim3p) being the predominant modification. A beta cell-specific isomiR signature of 30 sequences was identified, with isomiR-411-5p-Ext5p(+1) showing a significant inverse correlation with basal insulin secretion (p=0.0009, partial R2=0.68) and total insulin secretion (p=0.005, partial R2=0.54). Overexpression of isomiR-411-5p-Ext5p(+1), but not of its canonical counterpart, importantly reduced GSIS by 51% ( ± 15.2%; mean ± SD) (p=0.01) in EndoC-βH1 cells. Transcriptomic analysis performed in EndoC-βH1 cells and CI-HI identified 47 genes significantly downregulated by isomiR-411-5p-Ext5p(+1) (false discovery rate [FDR]<0.05) but not by the canonical miRNA, with enriched pathways related to Golgi vesicle biogenesis (FDR=0.017) and trans-Golgi vesicle budding (FDR=0.018). TargetScan analysis confirmed seed sequence-dependent target specificity for 81 genes uniquely regulated by the isomiR (p=1.1 × 10⁻⁹).

Conclusions/interpretation: This study provides the first comprehensive isomiR profiling in human islets and beta cells, revealing their substantial contribution to miRNA regulation. IsomiR-411-5p-Ext5p(+1) emerges as a distinct key modulator of insulin secretion and granule dynamics in beta cells. These findings highlight isomiRs as potential biomarkers and therapeutic targets for diabetes, warranting further exploration of their roles in beta cell biology.

Keywords: Beta cell; Beta cell function; Human pancreatic islets; Insulin secretion; IsomiRs; MicroRNAs; Non-coding RNAs.


Conflict of interest statement

Acknowledgements: The secretarial help of A. Mechini and M. Prencipe was highly appreciated. BioRender.com images tool was used to generate the Graphical abstract. Data availability: Raw and analysed data are available from the corresponding author upon request. Funding: This work is supported by the European Union (EU) within the Italian Ministry of University and Research (MUR) PNRR ‘National Center for Gene Therapy and Drugs based on RNA Technology’ (Project No. CN00000041 CN3 Spoke #5 ‘Inflammatory and Infectious Diseases’), and by the Innovative Medicines Initiative 2 (IMI2) Joint Undertaking under grant agreement No.115797 INNODIA and No.945268 INNODIA HARVEST. This joint undertaking receives support from the Union’s Horizon 2020 research and innovation programme and EFPIA, Breakthrough T1D (former JDRF) and The Leona M. and Harry B. Helmsley Charitable Trust). The work is also supported by the Italian Ministry of Health through ‘Bando Ricerca Finalizzata 2018’ GR-2018-12365577: ‘The study of human pancreatic islet cell plasticity to predict diabetes onset, progression and personalize therapy’. GS, AP and TM are supported by the Italian Ministry of University and Research (PNRR-PRIN2022 No. P2022EB5B8 and PRIN2022 No.2022FRBXHY). GS is supported by the University of Siena within F-CUR funding program Grant No. 2268-2022-SG-PSR2021-FCUR_001. FD was supported by the Italian Ministry of University and Research with the project PNC 0000001 D3 4 Health, the National Plan for Complementary Investments to the NRRP, funded by the NextGenerationEU, and by the Italian Ministry of Health 'Multidisciplinary and Interregional Hub for Research and Clinical Experimentation To Combat Pandemics and Antibiotic Resistance' (project T4-AN-07, PAN-HUB). Authors’ relationships and activities: The authors declare that there are no relationships or activities that might bias, or be perceived to bias, their work. Contribution statement: SA, EA and GEG contributed to the conceptualisation, supervision and coordination of the study, the design of the methodology, conducted the investigation and implemented the bioinformatics and statistical analysis, composed the figures and wrote and reviewed the manuscript. DF, GL, AMo, AFB, EP, LN and CF conducted the experiments and the analyses and interpreted the data. MB contributed to the design of the methodology. CG contributed to the investigation and to the design of the methodology. GQ and VT contributed to the investigation and to the design of the methodology. GDG, LS and GC contributed to the investigation and to the design of the methodology. AMa contributed to the investigation. AG and TM contributed to the investigation, to the design of the methodology and helped acquire funding for the research. AP contributed to the investigation to the design of the methodology and helped acquire funding for the research. RR contributed to the investigation and to the design of the methodology. FD and GS contributed to the conceptualisation, supervision and coordination of the study and the design of the methodology, wrote and reviewed the manuscript and helped acquire funding for the research. FD and GS are the guarantors of this work and, as such, had full access to all the data in the study and take responsibility for the integrity of the data and the accuracy of their analysis. All authors substantially contributed to the conception or design of the work, or acquisition, analysis or interpretation of data of the work. All authors critically reviewed the manuscript and approved the final version.

Figures

Fig. 1
Fig. 1
Analysis of isomiR and canonical miRNA profiles across different beta cell and islet samples. (a) Pie charts showing the distribution of isomiR and canonical miRNA forms in LCM-HI, CI-HI, EndoC-βH1 cells and sorted beta cells. The proportions of different isoforms are represented by different colours, as shown in the key. (be) Bar plots representing the average counts and composition of individual top-10 expressed miRNA species in LCM-HI (b), CI-HI (c), EndoC-βH1 cells (d) and sorted beta cells (e). The bars are colour coded to show the contributions of canonical and different isomiR forms. (f) Clustermap representing the group assigned to each of the n=79 miRNAs with consistent expression in the four experiments. The group was assigned according to the isomiR class with the higher contribution to its expression. The assignment of the prevalent isomiR classes to each miRNA is colour coded. (g) PCA of miRNA expression profiles performed on the average isomiR composition for the n=4 islet/beta cell datasets and the n=99 cell types retrieved from the isomiRdb repository. The PCA shows that the first n=2 principal components separate the beta cell dataset from the other cell types, suggesting a specificity in their post-transcriptional modifications. LCM-HI, CI-HI, sorted beta cells and EndoC-βH1 cells are marked to indicate clustering according to their miRNA profiles
Fig. 2
Fig. 2
A beta cell isomiR signature is associated with functional parameters. (a) Workflow illustrating the filtering steps applied to identify a robust isomiR signature across human islet and beta cell datasets. The numbers indicate the number of sequences remaining after each step: (1) removal of canonical miRNAs, (2) exclusion of isomiRs with an average expression <20 normalised counts, (3) elimination of isomiRs contributing less than 50% to the expression of their corresponding canonical miRNAs. The final signature was derived from the intersection of the remaining isomiRs in the islet and beta cell datasets, ensuring reliability. (b) Pie charts showing the average contribution of isomiRs with seed variations to the total miRNA expression in islet and beta cell datasets. The percentages (mean ± SD) are colour coded to distinguish contributions of sequences with conserved and non-conserved seed sequences. (cd) Bar plots showing the average expression composition of miR-409-3p (c) and miR-411-5p (d) with their canonical sequences, isomiR sequences with seed variation identified in the beta cell signature and other isomiR sequences across islet and beta cell datasets (the seed sequence is highlighted in green for the isomiR [Iso] and canonical miRNA [miR]). Each bar represents the mean contribution of the selected isomiR, the canonical sequence and other detected sequences for the miRNA, distinguished by different colours. (e) Correlation plot (corrplot) depicting significant associations between isomiRs and beta cell metabolic parameters (p<0.05). Associations were determined using multiple linear regression models, adjusted for age, sex and BMI. The square root of the partial R2 value, multiplied by the coefficient sign, is shown to indicate the strength and direction of the relationship. Colour intensity corresponds to the magnitude of the association, as indicated in the legend. The isomiR name is composed of the originating miRNA, the isomiR class and the number of added or trimmed nucleotides in brackets. (f, g) Scatter plots illustrating the association of isomiR-411-5p-Ext5p(+1) and its canonical miRNA counterpart with total ISR (f) and basal ISR (g). While the isomiR exhibits a significant correlation, no such association is observed for the canonical miRNA. The x-axis represents the log₂-transformed expression values, adjusted for covariates (age, sex and BMI). The p value for the clinical parameter’s coefficient and the partial R2 are provided for each plot. Cts, counts; expr., expression
Fig. 3
Fig. 3
IsomiR-411-5p-Ext5p(+1) overexpression modulates GSIS in EndoC-βH1. (a) Schematic representation of the experimental workflow. EndoC-βH1 cells were transfected with either a scrambled control, miR-411-5p, or its isomiR [isomiR-411-5p-Ext5p(+1)] for 24 h. Following transfection, samples were analysed using small RNA-seq, GSIS and transcriptomics to assess functional and molecular changes. (b) Quantification of miRNA and isomiR expression levels in transfected EndoC-βH1 cells as determined by small RNA-seq. Read counts for detected sequences of miR-411-5p and isomiR-411-5p-Ext5p(+1) are presented on a log2 scale; n=3 independent experiments. (c, d) Insulin secretion was assessed in EndoC-βH1 cells not-transfected, transfected with scrambled control, miR-411-5p mimic or isomiR-411-5p-Ext5p(+1) mimic sequences and treated with (c) low glucose (0 mmol/l) or (d) high glucose (20 mmol/l). The boxplots report the median alongside min-to-max error bars of the percentage of insulin secreted over total insulin content. (e) Boxplot showing the median alongside min-to-max error bars of the stimulation index calculated as the ratio between high glucose (20 mmol/l) and low glucose (0 mmol/l) insulin secretion normalised for insulin content. n=8 independent experiments. Statistics using Friedman test with Dunn’s multiple comparison; *p<0.05. Det. Seq. detected sequences; HG, high glucose (20 mmol/l); Iso, isomiR-411-5p-Ext5p(+1)/isomiR-411 mimic; LG, low glucose (0 mmol/l); miR, miR-411-5p/miR-411 mimic; nt, not-transfected; Scr, scrambled control
Fig. 4
Fig. 4
IsomiR-411-5p-Ext5p(+1) targets different genes compared with the canonical miRNA in EndoC-βH1 and CI-HI. (a, b) Volcano plots illustrating genes differentially expressed following transfection of isomiR (a) or canonical miRNA (b) compared with scrambled controls in the EndoC-βH1 cell line. The x-axis represents the log₂ fold change in expression relative to scrambled controls, while the y-axis shows the –log₁₀ adjusted p values. Genes are colour coded to indicate those regulated by both isomiR and canonical miRNA or specifically by either one. (c) Heatmap showing the z scores of log₂-scaled expression values for genes differentially expressed following isomiR-411-5p-Ext5p(+1) or canonical miR-411-5p transfection compared with scrambled controls. Genes are colour coded to indicate those regulated by both isomiR and canonical miRNA or specifically by either one. (d) Venn diagram showing the overlap of genes downregulated by isomiR-411-5p-Ext5p(+1) and canonical miR-4115p in EndoC-βH1 cells. The diagram indicates that the majority of genes downregulated by the isomiR are not affected by the canonical miRNA, with the number of genes and percentages reported. (e) Heatmap of the z scores for log₂-scaled expression values of the 47 genes specifically downregulated by isomiR-411-5p-Ext5p(+1) in both EndoC-βH1 cells and CI-HI. Hierarchical clustering was performed based on gene expression patterns, and gene names are listed on the right. (f) Reactome pathways enriched in genes specifically downregulated by isomiR-411-5p-Ext5p(+1). The pathway names, associated genes, p values and FDRs are shown. (gj) Bar plots showing the fold change in expression for transcripts specifically downregulated by isomiR-411-5p-Ext5p(+1) in both EndoC-βH1 cells and CI-HI. Gene-specific downregulation is shown for AP4E1 (g), CPD (h), OCRL (i) and PIK3C2A (j). Fold changes were calculated relative to scrambled-transfected controls, with a representative scrambled sample used as the reference to account for variability; *p<0.05. cts, counts; Diff. differentially/differential; EndoC, EndoC-βH1; Expr., expressed; Iso, isomiR-411-5p-Ext5p(+1)/isomiR-411 mimic; miR, miR-411-5p/miR-411 mimic; Scr, scrambled control

References

    1. Lee RC, Feinbaum RL, Ambros V (1993) The C. elegans heterochronic gene lin-4 encodes small RNAs with antisense complementarity to lin-14. Cell 75:843–854. 10.1016/0092-8674(93)90529-y - PubMed
    1. Gebert LFR, MacRae IJ (2019) Regulation of microRNA function in animals. Nat Rev Mol Cell Biol 20:21–37. 10.1038/s41580-018-0045-7 - PMC - PubMed
    1. Bartel DP (2018) Metazoan MicroRNAs. Cell 173:20–51. 10.1016/j.cell.2018.03.006 - PMC - PubMed
    1. Mendell JT, Olson EN (2012) MicroRNAs in stress signaling and human disease. Cell 148:1172–1187. 10.1016/j.cell.2012.02.005 - PMC - PubMed
    1. Kozomara A, Birgaoanu M, Griffiths-Jones S (2019) miRBase: from microRNA sequences to function. Nucleic Acids Res 47:D155–D162. 10.1093/nar/gky1141 - PMC - PubMed

LinkOut - more resources