. 2025 Dec;17(1):2478306.
doi: 10.1080/19490976.2025.2478306. Epub 2025 Mar 18.

In vitro competition with Bifidobacterium strains impairs potentially pathogenic growth of Clostridium perfringens on 2'-fucosyllactose

Affiliations

In vitro competition with Bifidobacterium strains impairs potentially pathogenic growth of Clostridium perfringens on 2'-fucosyllactose

Aruto Nakajima et al. Gut Microbes. 2025 Dec.

Abstract

Fortifying infant formula with human milk oligosaccharides, such as 2'-fucosyllactose (2'-FL), is a global trend. Previous studies have shown the inability of pathogenic gut microbes to utilize 2'-FL. However, the present study demonstrates that the type strain (JCM 1290T) of Clostridium perfringens, a pathobiont species often more prevalent and abundant in the feces of C-section-delivered infants, exhibits potentially pathogenic growth on 2'-FL. The expression of genes for α-toxin, an activator of NLRP3 inflammasome, and ethanolamine ammonia-lyase, a factor responsible for the progression of gas gangrene, was significantly upregulated during 2'-FL assimilation compared to growth on lactose. However, colony-forming unit of C. perfringens JCM 1290T markedly decreased when co-cultivated with selected strains of Bifidobacterium, a taxon frequently detected in the breastfed infant gut. Moreover, during co-cultivation, the expression of virulence-related genes, including the gene for perfringolysin O - another activator of NLRP3 inflammasome - were significantly downregulated, while the lactate oxidation genes were upregulated. This can occur through two different mechanisms: direct competition for 2'-FL between the two organisms, or cross-feeding of lactose, released from 2'-FL by C. perfringens JCM 1290T, to Bifidobacterium. Attenuation of α-toxin production by the selected Bifidobacterium strains was observed to varying extents in 2'-FL-utilizing C. perfringens strains clinically isolated from healthy infants. Our results warrant detailed in vivo studies using animal models with dysbiotic microbiota dominated by various types of C. perfringens strains to further validate the safety of 2'-FL for clinical interventions, particularly on vulnerable preterm infants.

Keywords: 2'-fucosyllactose; Bifidobacteria; Clostridium perfringens; α-toxin.


Conflict of interest statement

Employment of MS (since October, 2020), MNO (since April, 2021), and TomK (from April, 2021 to March, 2022) at Kyoto University is in part supported by Morinaga Milk Industry Co., Ltd. RM, KY, J-ZX, and TO are employees of Morinaga Milk Industry Co., Ltd. DAR is a co-founder of PhenoBiome Inc.

Figures
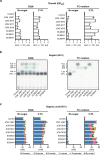
Figure 1.
Figure 1.
C. perfringens strains assimilate 2'-FL in YC medium. a, growth of four JCM and three clinical C. perfringens strains cultivated in RCM (left panel) and YC medium (right panel) supplemented without or with 1% 2'-FL. The growth is represented by the area under the curve (AUC, arbitrary unit) (see supplementary figure 3a). Bacteria-free medium was used as a control. Bars represent the mean of two independent experiments, with each data point shown by a circle. b, TLC analysis of sugars in supernatants of C. perfringens strains grown on 2'-FL for 48 h. The results shown are representative of two independent experiments. c, organic acid production post 48 h cultivation. Concentrations of organic acids are represented by stacked bar charts with acetate, butyrate, formate, lactate, propionate, and pyruvate shown in blue, pink, green, khaki, cyan, and purple, respectively. Neither valerate, iso-valerate, nor succinate was detected. Bars represent the mean of two independent experiments, with each data point indicating the total amount of detected organic acids (see supplementary figure 3b for the concentrations of individual organic acids). Samples obtained in (a) were used for the analysis. See the source data file for the individual data points corresponding to the graphs (a and c).
Figure 2.
Figure 2.
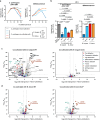
Elevated expression of virulence-related genes in C. perfringens JCM 1290T grown on 2'-FL. a, a volcano plot comparing the normalized gene expression values of cells grown on 2'-FL versus those grown on Lac. Fold changes (log2) and adjusted p values (−log10) obtained by multiple t-tests with false discovery rate correction were used for plotting. C. perfringens JCM 1290T was used for the analysis. Selected genes are shown in different colors with their functions or names. RNA-seq data from three biological replicates were used for the analysis (see supplementary tables 1 and 2). b and c, sialidase activity and the concentration of 1-propanol in supernatants of C. perfringens JCM 1290T grown in YC medium supplemented with 1% Lac (≈29 mM) or 2'-FL (≈20 mM). Supernatants collected when the cells were harvested for (a) were used for measuring NeuAc-releasing activity (b). PGM was used as a substrate. 1-propanol was quantified using the supernatant post 24 h cultivation (c) (see supplementary figure 7). Bars and whiskers represent the mean ± standard deviation (SD) of three independent experiments, with each data point shown by a circle. Statistical significance was evaluated by two-tailed t-test (b). d, the metabolic pathway for Fuc utilization in C. perfringens JCM 1290T reconstructed in the mcSEED database. Fuc is split into lactaldehyde and dihydroxyacetone phosphate after isomerization and phosphorylation in the cytoplasm. While the latter is sent to glycolysis, the former is converted to 1-propanol. Fuc transporter and catabolic enzymes are shown with their locus tags and common names. Log2FC values (2'-FL/Lac) obtained in the transcriptome analysis (a) are shown in parentheses. The genes of Fuc- and propanediol utilization clusters are enclosed with pink- and purple boxes, respectively. The genes in the propanediol utilization cluster can also be involved in a reductive glycerol utilization pathway. See the source data file for the individual data points corresponding to the graphs (b and c).
Figure 3.
Figure 3.
Varied ability of Bifidobacterium strains to reduce CFU of C. perfringens JCM 1290T grown on 2'-FL. C. perfringens JCM 1290T was co-cultivated with 20 different Bifidobacterium strains in YC medium supplemented with 0.5% 2'-FL for 24 h. a, change in CFU compared between post co-cultivation and post mono-cultivation of C. perfringens JCM 1290T. Log10 values are shown. The genotypes for FL-SBP (the solute-binding protein of FL transporter), Fum (cytoplasmic fuc metabolism), FucP (fuc permease), and AfcA (GH family 95 1,2-α-l-fucosidase) of Bifidobacterium strains are indicated. in and ex represent intracellular and extracellular localization of AfcA, respectively. b, ratio of post co-cultivation CFU of bifidobacteria to that of C. perfringens JCM 1290T. Log10 values are shown. Bars represent the mean of two independent experiments, with each data point shown by a circle (a and b). c, concentrations of acetate (blue), butyrate (pink), formate (green), lactate (khaki), propionate (cyan), and pyruvate (purple) in the supernatants post 24 h cultivation are shown in stacked bar charts. Neither valerate, iso-valerate, nor succinate was detected. Bars represent the mean of two independent experiments, with each data point indicating the total amount of detected organic acids (see supplementary figure 9 for the concentrations of individual organic acids). d, PCA plots based on the organic acid concentrations in the supernatants. Data obtained in (c) are used for plotting. Circle size represents the extent of decrease in CFU of C. perfringens after co-cultivation compared to mono-cultivation. Data shown in (a) were used for plotting. Arrows indicate the contribution of respective organic acids to the principal components. See the source data file for the individual data points corresponding to the graphs (a–c).
Figure 4.
Figure 4.
Selected Bifidobacterium strains impair a potentially pathogenic growth of C. perfringens JCM 1290T on 2'-FL. a, time-dependent changes in CFU of C. perfringens JCM 1290T during mono-cultivation (gray) and co-cultivation with B. longum MCC10007 or B. breve MCC1851 (left panel). WT (blue) and fumC (cyan) strains of B. longum MCC10007 and WT (red) and fucP (orange) strains of B. breve MCC1851 were used for co-cultivation. CFU of co-cultivated Bifidobacterium strains is also shown (right panel). 2'-FL was used as a carbon source. Data are mean ± SD of three biological replicates. b, CFU of C. perfringens JCM 1290T and Bifidobacterium strains post 24 h co-cultivation is shown. Data in (a) were used. Bars and whiskers represent mean ± SD, with each data point shown by a circle. Tukey’s test following one-way ANOVA was used for statistical analysis. p values of less than 0.05 are indicated. c and d, volcano plots comparing the normalized gene expression values between the co-cultivated and mono-cultivated C. perfringens JCM 1290T post 12 h cultivation. WT and fumC strains of B. longum MCC10007 (c) and WT and fucP strains of B. breve MCC1851 (d) were used for co-cultivation. Fold changes (log2) and adjusted p values (−log10) obtained by multiple t-tests with false discovery rate correction were used for plotting. Selected genes are shown in different colors with their functions or names. RNA-seq data of three biological replicates were used for the analysis (supplementary tables 1 and 7–10). See the source data file for the individual data points corresponding to the graphs (a and b).
Figure 5.
Figure 5.
Alpha-toxin production by several C. perfringens strains upon co-cultivation with selected Bifidobacterium strains. a and b, relative α-toxin levels in the supernatants. Samples collected when cells were harvested for RNA-seq (figure 4c,d) were used for the assay (a). Three clinical C. perfringens strains were similarly co-cultivated with B. longum MCC10007 or B. breve MCC1851 (b). Bars and whiskers represent the mean ± SD of three independent experiments, with each data point shown by a circle. The asterisk indicates the lowest detection limit for α-toxin in the assay. Tukey’s test following one-way ANOVA was used for statistical analysis. p values of less than 0.05 are indicated. See the source data file for the individual data points corresponding to the graphs (a and b).

References

    1. Sarkar A, Yoo JY, Valeria Ozorio Dutra S, Morgan KH, Groer M.. The association between early-life gut microbiota and long-term health and diseases. J Clin Med. 2021;10(3):459. doi: 10.3390/jcm10030459. - DOI - PMC - PubMed
    1. Urashima T, Katayama T, Sakanaka M, Fukuda K, Messer M. Evolution of milk oligosaccharides: origin and selectivity of the ratio of milk oligosaccharides to lactose among mammals. Biochim Biophys Acta - Gen Subj. 2022;1866(1):130012. doi: 10.1016/j.bbagen.2021.130012. - DOI - PubMed
    1. McGuire M, Meehan CL, McGuire MA, Williams JE, Foster J, Sellen DW, Kamau-Mbuthia EW, Kamundia EW, Mbugua S, Moore SE, et al. What’s normal? Oligosaccharide concentrations and profiles in milk produced by healthy women vary geographically. Am J Clin Nutr. 2017;105(5):1086–19. doi: 10.3945/ajcn.116.139980. - DOI - PMC - PubMed
    1. V CG, Zampini L, Galeazzi T, Facinelli B, Ferrante L, Capretti R, Orazio G. Human milk oligosaccharides inhibit the adhesion to caco-2 cells of diarrheal pathogens Escherichia coli, Vibrio cholerae, and Salmonella fyris. Pediatr Res. 2006;59(3):377–382. doi: 10.1203/01.pdr.0000200805.45593.17. - DOI - PubMed
    1. Sodhi CP, Wipf P, Yamaguchi Y, Fulton WB, Kovler M, Niño DF, Zhou Q, Banfield E, Werts AD, Ladd MR, et al. The human milk oligosaccharides 2’-fucosyllactose and 6’-sialyllactose protect against the development of necrotizing enterocolitis by inhibiting toll-like receptor 4 signaling. Pediatr Res. 2021;89(1):91–101. doi: 10.1038/s41390-020-0852-3. - DOI - PMC - PubMed

MeSH terms

LinkOut - more resources