Randomized Controlled Trial
. 2025 Mar 18;16(1):2683.
doi: 10.1038/s41467-025-57838-y.

Maternal balanced energy-protein supplementation reshapes the maternal gut microbiome and enhances carbohydrate metabolism in infants: a randomized controlled trial

Affiliations
Randomized Controlled Trial

Maternal balanced energy-protein supplementation reshapes the maternal gut microbiome and enhances carbohydrate metabolism in infants: a randomized controlled trial

Lishi Deng et al. Nat Commun. .

Abstract

Balanced energy-protein (BEP) supplementation during pregnancy and lactation can improve birth outcomes and infant growth, with the gut microbiome as a potential mediator. The MISAME-III randomized controlled trial (ClinicalTrial.gov: NCT03533712) assessed the effect of BEP supplementation, provided during pregnancy and the first six months of lactation, on small-for-gestational age prevalence and length-for-age Z-scores at six months in rural Burkina Faso. Nested within MISAME-III, this sub-study examines the impact of BEP supplementation on maternal and infant gut microbiomes and their mediating role in birth outcomes and infant growth. A total of 152 mother-infant dyads (n = 71 intervention, n = 81 control) were included for metagenomic sequencing, with stool samples collected at the second and third trimesters, and at 1-2 and 5-6 months postpartum. BEP supplementation significantly altered maternal gut microbiome diversity, composition, and function, particularly those with immune-modulatory properties. Pathways linked to lipopolysaccharide biosynthesis were depleted and the species Bacteroides fragilis was enriched in BEP-supplemented mothers. Maternal BEP supplementation also accelerated infant microbiome changes and enhanced carbohydrate metabolism. Causal mediation analyses identified specific taxa mediating the effect of BEP on birth outcomes and infant growth. These findings suggest that maternal supplementation modulates gut microbiome composition and influences early-life development in resource-limited settings.


Conflict of interest statement

Competing interests: The authors declare no competing interests. Inclusion & Ethics statement: The study was approved by the Commissie voor Medische Ethiek (CME) of Ghent University Hospital (protocol code: B670201734334 and date of 10/08/2020) and the Comité d’Éthique Institutionnel de la Recherche En Sciences de la Santé (CEIRES) of the Institut de Recherche en Sciences de la Santé (IRSS) (protocol code: 50-2020/CEIRES and date of 22/10/2020). An independent Data and Safety Monitoring Board (DSMB), which included an endocrinologist, two pediatricians, a gynecologist, and an ethicist from Belgium and Burkina Faso, was established prior to the trial. The DSMB managed remote safety reviews for adverse and serious events at nine and 20 months after the start of enrollment. The MISAME-III trial was registered on ClinicalTrials.gov (identifier: NCT03533712). The research was conducted in collaboration with local partners, including Agence de Formation de Recherche et d’Expertise en Santé pour l’Afrique (AFRICSanté) and IRSS. Researchers from AFRICSanté and IRSS who contributed to the research and fulfilled the authorship criteria were included as co-authors, while other team members, such as physicians and midwives who contributed to data collection, were acknowledged in the Acknowledgements section. Roles and responsibilities were agreed upon among collaborators ahead of the research initiation. A clear delineation of tasks and contributions was outlined in collaborative meetings and documented in written agreements to ensure effective coordination and execution of the study objectives. Additionally, capacity-building plans for local researchers were discussed and integrated into the research framework, including training sessions, knowledge-sharing initiatives, and authorship opportunities. The research does not lead to stigmatization, incrimination, discrimination, or personal risk for participants. Thorough risk assessments were conducted prior to the commencement of the research to identify and evaluate potential hazards and risks associated with various aspects of the study. These assessments considered factors such as environmental conditions, exposure to hazardous materials, and travel risks. Benefit-sharing measures have been discussed in the event that biological materials, cultural artifacts, or associated traditional knowledge are transferred outside the country. Local and regional research relevant to our study has been taken into account in our citations.

Figures

Fig. 1
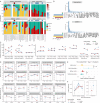
Fig. 1. Baseline characteristics, maternal and infant anthropometry, and sample collection timeline.
Pie charts depict the baseline characteristics of the study participants, including health center, ethnicity, religion, education level, food insecurity, number of jobs, parity, and anemia for each group. Box plots present other measures, such as the age of the participants, BMI, height, weight, hemoglobin levels, and wealth index, along with minimum dietary diversity score and gestational weight gain during pregnancy. Birth outcomes are displayed using box plots and bar plots. Infant anthropometry data are presented as growth curves for weight, length, and corresponding Z-scores (WAZ, LAZ, and WLZ) during the first six months of life, comparing the intervention and control groups. Box plots indicate median (middle line), 25th, 75th percentile (box), and the smallest and largest values within 1.5 × interquartile range (IQR) from the box (whiskers). Data points beyond this range are considered outliers (single points). Data in line plots are presented as mean ± standard error. BMI body mass index, GWG gestational weight gain, MDDW minimum dietary diversity for women, Pn12 postnatal 1–2 months, Pn56 postnatal 5–6 months, Tri2 trimester 2, Tri3 trimester 3, LAZ length-for-age Z-score, WAZ weight-for-age Z-score, WLZ weight-for-length Z-score.
Fig. 2
Fig. 2. Relative abundance, diversity, and gene richness in maternal and infant samples across time points by groups.
A Relative abundance of the top 15 most abundant genera (averaged across all samples) aggregated by treatment groups and sample collection time points. Genera with lower abundance are grouped into the “Other” category. B Density plots showing the total number of microbial species detected per sample in maternal and infant stool samples. Box-and-jitter plots of (C) Shannon diversity indices and (E) gene richness grouped by intervention and control at each time point. Maternal samples: Interv.Tri2 (n = 22); Contr.Tri2 (n = 20); Interv.Tri3 (n = 71); Contr.Tri3 (n = 78); Interv.Pn12 (n = 66); Contr.Pn12 (n = 76); Interv.Pn56 (n = 67); Contr.Pn56 (n = 75). Infant samples: Interv.Pn12 (n = 66); Contr.Pn12 (n = 76); Interv.Pn56 (n = 58); Contr.Pn56 (n = 56). Box plots indicate median (middle line), 25th, 75th percentile (box), and the smallest and largest values within 1.5 × interquartile range (IQR) from the box (whiskers). Data points beyond this range are considered outliers (single points). Principal Coordinate Analysis (PCoA) ordination plots of (D) microbial species based on weighted UniFrac distance and (F) gene data based on Bray-Curtis distance. Interv intervention, Contr control, Tri2 trimester 2, Tri3 trimester 3, Pn12 postnatal 1–2 months, Pn56 postnatal 5–6 months.
Fig. 3
Fig. 3. Temporal stability of maternal and infant gut microbiomes across time points by groups.
A Bar plots of taxa recurrence rates within each phylum. B UpSet plots showing the number of shared strains across different time points and mother-infant pairs. Line plots displaying the relative abundance of (C) taxa shared between mothers and infants across time points and (D) the top ten most abundant species in both mother and infant samples. The species shown have a minimum abundance of 1% and are present in at least five samples across the time points (excluding the second trimester due to limited measurements). Data are presented as mean ± standard error. E Linear regression between dissimilarity (beta diversity) against collection date interval, comparing intra-subject microbiome stability across groups. Data are presented as the estimated effect size of the predictor (days interval) on the outcome (intra subject distance) obtained from the mixed-effects model, and the lower and upper bounds of the 95% confidence interval on the effect estimate. The Infant-control group has infinite lower and upper confidence intervals (dashed line). Number of subjects: Infant-control n = 52; Infant-intervention n = 54; Mother-control n = 79; Mother-intervention n = 68. F Shifts in microbiome over time, assessed by intra-subject distance using weighted UniFrac. Data are presented as mean ± standard error. Number of subjects: Infant-control n = 52; Infant-intervention n = 54; Mother-control n = 79; Mother-intervention n = 68. Tri2 trimester 2, Tri3 trimester 3, Pn12 postnatal 1–2 months, Pn56 postnatal 5–6 months.
Fig. 4
Fig. 4. Co-occurrence network analysis of maternal and infant microbiomes across time points by groups.
Co-occurrence networks for (A) maternal samples at four time points and (B) infant samples at two time points. Nodes represent microbial taxa, with edges indicating significant co-occurrence relationships between taxa. Node size is proportional to the degree (number of connections), and colors indicate different communities identified by Louvain clustering. C Topological properties of the ecological networks depicting co-occurrence of the gut microbiome, including nodes, edges, clustering coefficient, network density, network diameter, Louvain community count, and modularity for both maternal and infant samples. Significant differences between the intervention and control groups were determined using a two-sided permutation test (1000 permutations), with significance set at p < 0.05. The p < 0.001 indicates a p = 0 returned when using 1000 permutations. Tri2 trimester 2, Tri3 trimester 3, Pn12 postnatal 1–2 months, Pn56 postnatal 5–6 months.
Fig. 5
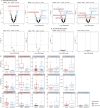
Fig. 5. Differential taxa identified by ANCOM-BC2 in maternal and infant samples across time points.
Volcano plots showing differential abundant taxa associated with the intervention (A) at each time point for both maternal and infant samples, and (B) across all time points combined (excluding the second trimester due to limited measurements). ANCOM-BC2 employs a two-sided test. Each point represents a taxon. The x-axis represents log2 fold change (log2FC) in abundance, and the y-axis represents Benjamini-Hochberg adjusted p-values. Horizontal dashed lines indicate the thresholds of statistical significance (i.e., adjusted p-values < 0.05), and vertical dashed lines represent |log2FC| > 0.5. Colored dots indicate taxa significantly enriched (blue) and depleted (red) in the intervention group compared to the control group. Results were confirmed through sensitivity analysis for pseudo-counts. Maternal samples: Interv.Tri2 (n = 22); Contr.Tri2 (n = 20); Interv.Tri3 (n = 71); Contr.Tri3 (n = 78); Interv.Pn12 (n = 66); Contr.Pn12 (n = 76); Interv.Pn56 (n = 67); Contr.Pn56 (n = 75). Infant samples: Interv.Pn12 (n = 66); Contr.Pn12 (n = 76); Interv.Pn56 (n = 58); Contr.Pn56 (n = 56). A full table of ANCOM-BC2 outputs can be found in Supplementary Data 1. C Boxplots displaying the relative abundance of the 16 taxa with |log2FC| > 0.5 that were significantly different between the intervention and control groups. Only taxa with an abundance > 0 were plotted. Box plots indicate median (middle line), 25th, 75th percentile (box), and the smallest and largest values within 1.5 × interquartile range (IQR) from the box (whiskers). Data points beyond this range are considered outliers (single points). Interv intervention, Contr control, Tri2 trimester 2, Tri3 trimester 3, Pn12 postnatal 1–2 months, Pn56 postnatal 5–6 months.
Fig. 6
Fig. 6. Significantly enriched or depleted KEGG pathways associated with BEP supplementation in mothers and infants across time points.
The color of each point corresponds to the adjusted p-value (Benjamini-Hochberg correction), with warmer colors indicating more significant changes. The size of each point reflects the size of gene set associated with the pathway. A full table of the gene set enrichment analyses can be found in Supplementary Data 2. BEP balanced energy-protein, Pn12 postnatal 1–2 months, Pn56 postnatal 5–6 months, Tri2 trimester 2, Tri3 trimester 3.
Fig. 7
Fig. 7. Mediating effect of the microbiome on birth outcomes and infant anthropometry.
A Estimates for the NIE and the NDE of the microbiome diversity on gestational age at birth and on WAZ and stunting prevalence at six months. Results are superimposed on the causal directed acyclic graphs used in these analyses. The model with maternal Shannon diversity as mediator included maternal strata data as covariates (level of education, marital status, language, religion, ethnicity, number of jobs, socio-economic status, dietary diversity score, and health center), as well as maternal characteristics taken at inclusion into the trial (age, height, BMI and hemoglobin level). The model with infant microbiome diversity as a mediator also included the age at which the infant stopped exclusively breastfeeding as a covariate. Infant microbiome diversities were measured at 1–2 months of age. Estimates for the interventional direct (blue) and indirect (yellow) effects of each individual species’ abundance in the maternal microbiome in (B) the second trimester, (C) the third trimester, and (D) in the infant microbiome at 1−2 months of age. Data are presented as the estimated effect size from the mediation analysis, and the lower and upper bounds of the 95% confidence interval on the effect estimate. Maternal Tri2 samples: Gestational age (n = 42); Birth weight (n = 41); Birth length (n = 41). Maternal Tri3 samples: Gestational age (n = 147); Birth weight (n = 143); Birth length (n = 143). Infant Pn12 samples: WAZ at six months (n = 121); WLZ at six months (n = 121). The complete results of these mediation analyses are available in Supplementary Data 3. NIE Natural Indirect Effect, NDE Natural Direct Effect, BEP balanced energy-protein, Tri2 trimester 2, Tri3 trimester 3, Pn12 postnatal 1–2 months, WAZ weight-for-age Z-score, WLZ weight-for-length Z-score.

References

    1. UNICEF / WHO / World Bank Group. Levels and Trends in Child Malnutrition: UNICEF/WHO/World Bank Group Joint Child Malnutrition Estimates: Key Findings of the 2023 Edition. https://www.who.int/publications-detail-redirect/9789240073791 (2023).
    1. Black, R. E. et al. Maternal and child undernutrition and overweight in low-income and middle-income countries. Lancet382, 427–451 (2013). - PubMed
    1. Martorell, R., Khan, K. & Schroeder, D. G. Reversibility of stunting: epidemiological findings in children from developing countries. Revers. Stunt. Epidemiol. Find. Child. Dev. Ctries.48, S45–S57 (1994). - PubMed
    1. Victora, C. G., de Onis, M., Hallal, P. C., Blössner, M. & Shrimpton, R. Worldwide timing of growth faltering: revisiting implications for interventions. Pediatrics125, e473–e480 (2010). - PubMed
    1. Victora, C. G. et al. Revisiting maternal and child undernutrition in low-income and middle-income countries: variable progress towards an unfinished agenda. Lancet397, 1388–1399 (2021). - PMC - PubMed

Publication types

Substances

LinkOut - more resources