. 2025 Mar 18;16(1):2641.
doi: 10.1038/s41467-025-57544-9.

Guanine nucleotide biosynthesis blockade impairs MLL complex formation and sensitizes leukemias to menin inhibition

Affiliations

Guanine nucleotide biosynthesis blockade impairs MLL complex formation and sensitizes leukemias to menin inhibition

Xiangguo Shi et al. Nat Commun. .

Abstract

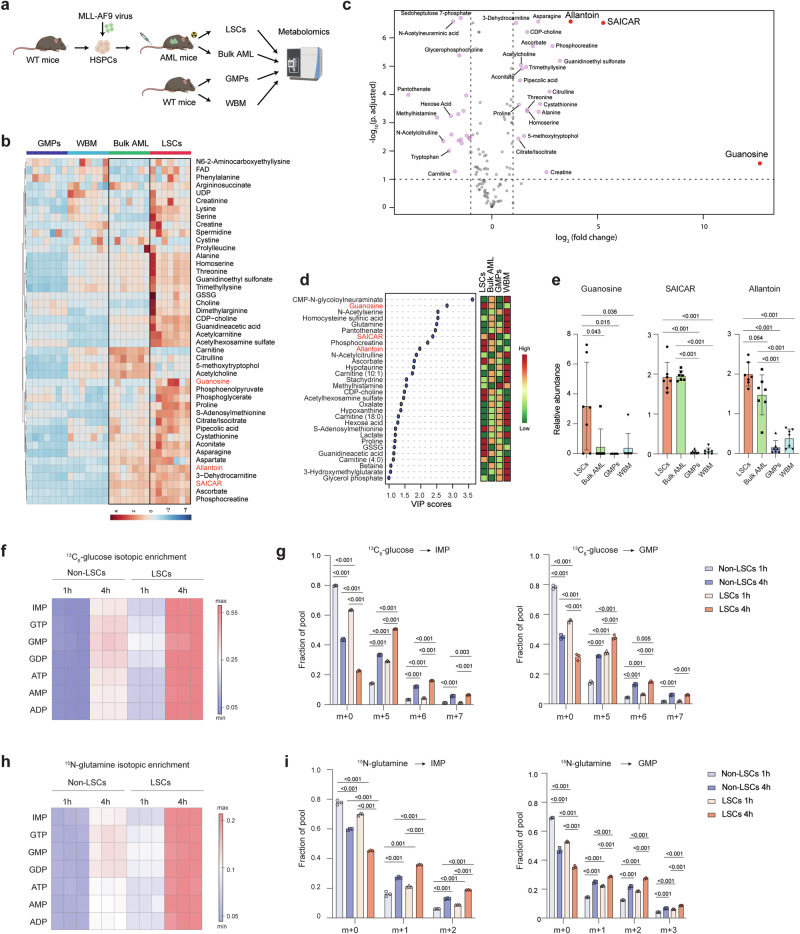
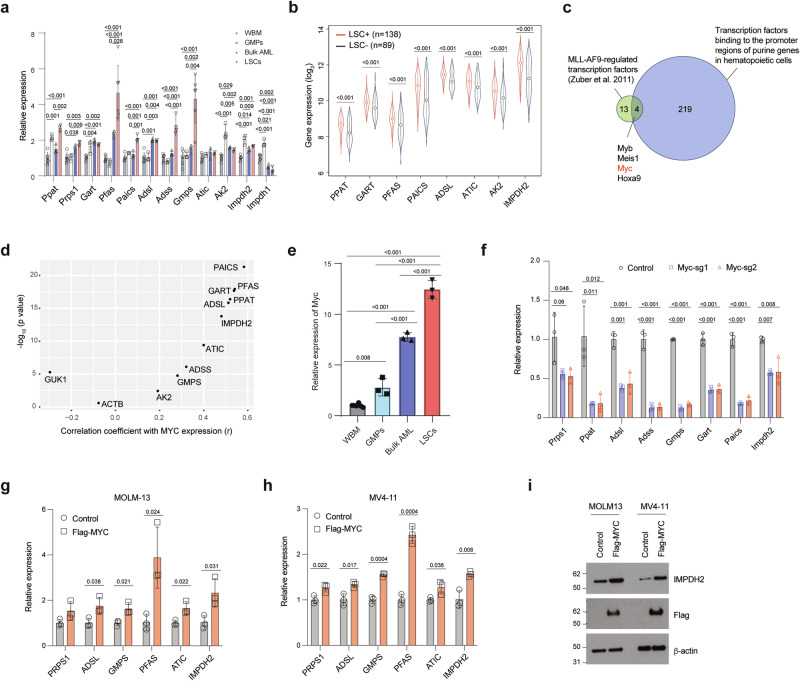
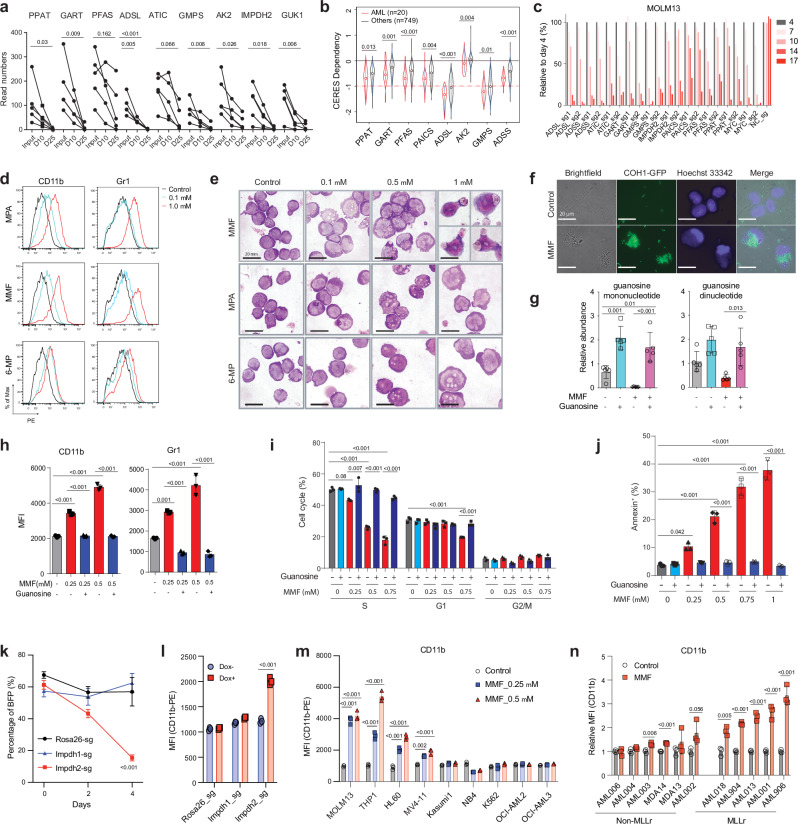
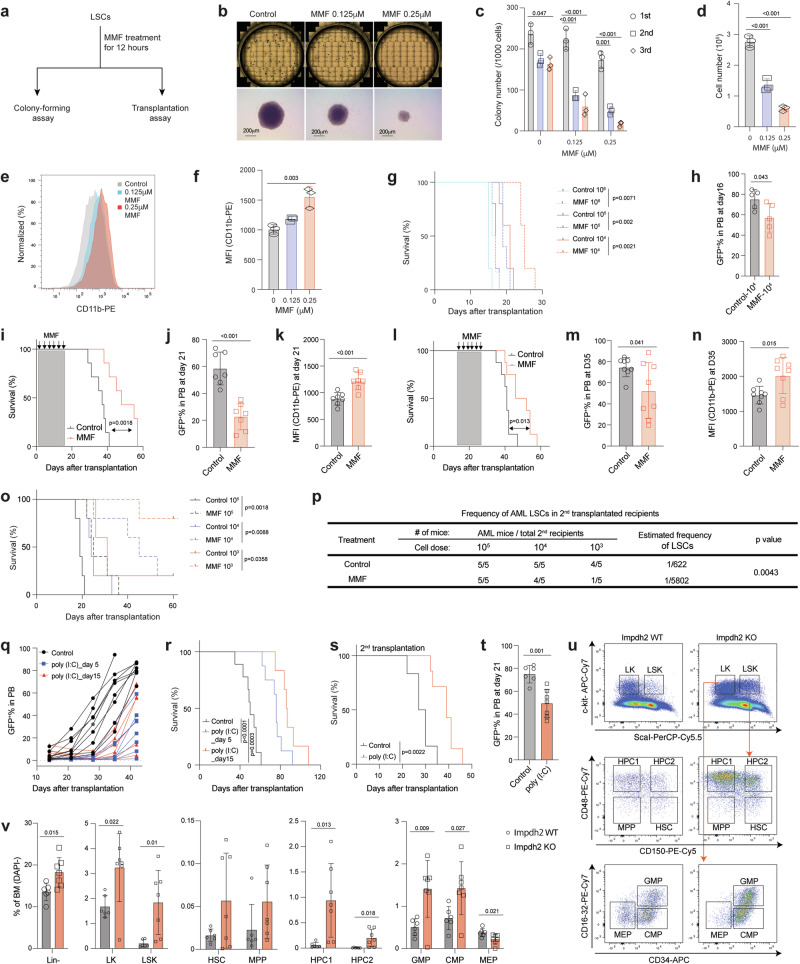
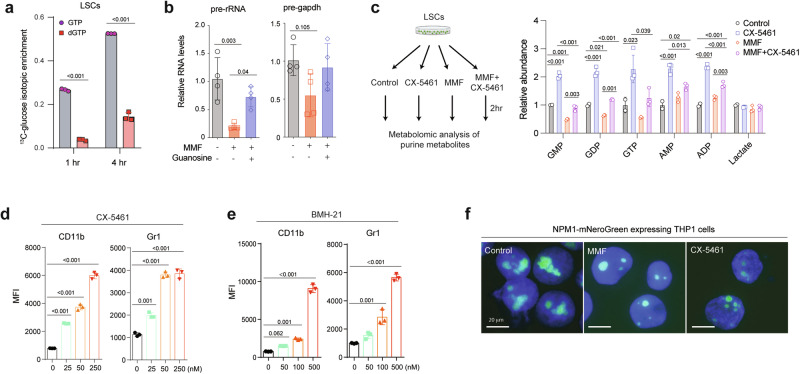
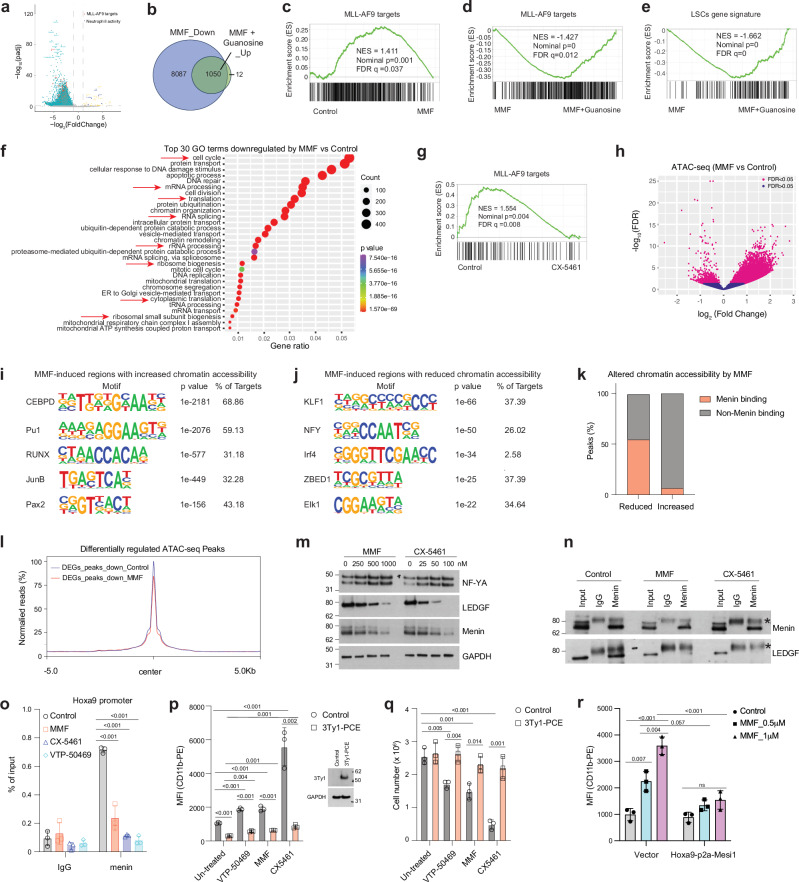
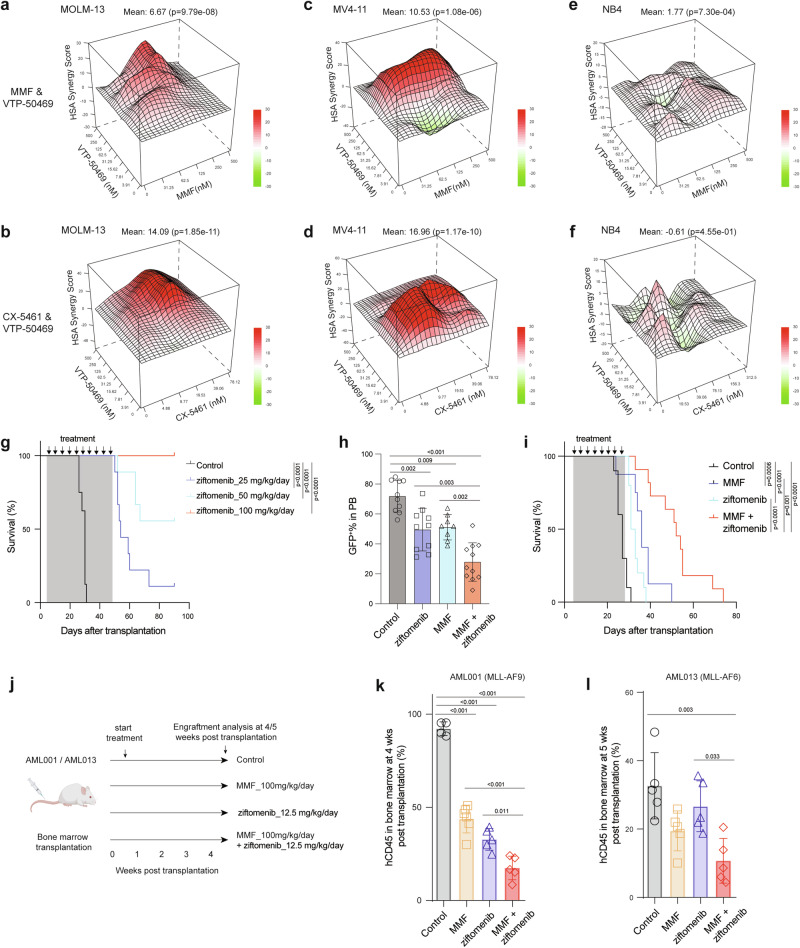
Targeting the dependency of MLL-rearranged (MLLr) leukemias on menin with small molecule inhibitors has opened new therapeutic strategies for these poor-prognosis diseases. However, the rapid development of menin inhibitor resistance calls for combinatory strategies to improve responses and prevent resistance. Here we show that leukemia stem cells (LSCs) of MLLr acute myeloid leukemia (AML) exhibit enhanced guanine nucleotide biosynthesis, the inhibition of which leads to myeloid differentiation and sensitization to menin inhibitors. Mechanistically, targeting inosine monophosphate dehydrogenase 2 (IMPDH2) reduces guanine nucleotides and rRNA transcription, leading to reduced protein expression of LEDGF and menin. Consequently, the formation and chromatin binding of the MLL-fusion complex is impaired, reducing the expression of MLL target genes. Inhibition of guanine nucleotide biosynthesis or rRNA transcription further suppresses MLLr AML when combined with a menin inhibitor. Our findings underscore the requirement of guanine nucleotide biosynthesis in maintaining the function of the LEDGF/menin/MLL-fusion complex and provide a rationale to target guanine nucleotide biosynthesis to sensitize MLLr leukemias to menin inhibitors.


Conflict of interest statement

Competing interests: K.T. received consultancy fees from Symbio Pharmaceuticals, honoraria from Mission Bio, Otsuka, and Illumina, and research funding from Onconova, ASTEX, and Jazz pharmaceuticals. G.C.I. received consultancy or advisory role fees from Novartis, Kura Oncology, Syndax Pharmaceuticals, Abbvie, Sanofi and NuProbe and received research funding from Celgene, Novartis, Kura Oncology, Syndax Pharmaceuticals, Merck, Cullinan Oncology, Astex, NuProbe, and received research funding from Break Through Cancer. The remaining authors declare no competing interests.

Figures

Fig. 1
Fig. 1. Purine metabolism is enhanced in LSCs.
a Schematic flowchart of the targeted metabolomics analysis in LSCs and bulk AML from MLL-AF9-induced murine AML and wild-type (WT) GMPs and whole bone marrow (WBM) cells from C57BL/6 mice. Created in BioRender. b Heatmap depicting the relative abundance of metabolites enriched in bulk AML and LSCs (see Supplementary Fig. 1a, Group 2) detected in LSCs, bulk AML, GMPs, and WBM cells (n = 7). c A volcano plot showing the abundance of metabolites in LSCs compared to GMPs. The metabolites in red are involved in purine biosynthesis and enriched in LSCs. d Variable importance in the projection (VIP, left panel) scores of metabolites detected in LSCs, bulk AML, GMP, and WBM cells. The color code on the right indicates the level of metabolites in each group (red: high, green: low). e Relative abundance of guanosine, SAICAR, and allantoin in LSCs, bulk AML, GMPs, and WBM cells (n = 7, biologically independent samples). f, h Heatmap depicting the isotopic enrichment of purine biosynthesis intermediates in LSCs and non-LSCs treated with 13C6-glucose (f) or amide-15N-glutamine (h) for 1 and 4 h (n = 3). g, i Fractional labeling of IMP (left panel) and GMP (right panel) in LSCs and non-LSCs treated with 13C6-glucose (g) or amide-15N-glutamine (i) for 1 and 4 h (n = 3, biological samples). h, hour. All data are represented as mean ± standard deviation (SD). p values in this figure were calculated by unpaired, two-tailed Welch’s t-test and Benjamini-Hochberg correction (c) and ANOVA with multiple comparisons analysis using Bonferroni correction post hoc analyses (e, g, and i). See also Supplementary Fig. 1 and Data 1. Source data are provided as a Source Data file.
Fig. 2
Fig. 2. MYC regulates the expression of purine biosynthetic genes in LSCs.
a Relative expression of purine biosynthetic genes in murine WBM cells (n = 6), GMPs (n = 3), MLL-AF9-induced AML (n = 3), and LSCs (n = 6, biologically independent samples). b Relative expression of purine biosynthetic genes from human AML LSC+ (n = 138) and LSC– (n = 89) (GEO: GSE76009). The box plot presents an interquartile range, and the whiskers show a 95% confidence interval. c A schematic showing the overlap between 17 transcription factors regulated by MLL-AF9 and 223 transcription factors that bind to the promoters of genes involved in purine biosynthesis. d Correlation between the expression of MYC and genes involved in purine biosynthesis. r, correlation coefficient. e Relative expression of Myc in WBM cells (n = 6), GMPs (n = 3), MLL-AF9-induced AML (n = 3), and LSCs (n = 3, biologically independent samples). f Relative expression of purine biosynthetic genes in Cas9-expressing LSCs expressing sgRNAs targeting control or Myc (n = 3, biologically independent samples). gi Relative expression of purine biosynthetic genes in MOLM-13 (g), MV4-11 cells (h), and immunoblotting analysis of IMPDH2, Flag-MYC, and β-actin on separate membranes in MOLM-13 and MV4-11 cells expressing a control vector or Flag-MYC (i) (n = 3, biologically independent samples). The immunoblots are representative from at least two independent experiments. All data are represented as mean ± SD. p values in this figure were calculated by Pearson/Spearman correlation test (d), unpaired, two-tailed Student’s t-test (b, g, and h) or ANOVA with multiple comparisons analysis using Bonferroni correction (a and e) or Dunnett’s (f) post hoc analyses. See also Supplementary Fig. 2. Source data are provided as a Source Data file.
Fig. 3
Fig. 3. Inhibition of purine biosynthesis promotes myeloid differentiation of LSCs in vitro.
a The read numbers of sgRNAs against purine biosynthetic genes at day 25 compared to day 10 and input from a whole-genome CRISPR screen in MOLM-13 cells; (n = 5, individual sgRNA). Each dot represents one sgRNA. D, day. b Cancer cell line dependency scores (CERES) of purine biosynthetic genes in AML (n = 20) and other cancers (n = 749) from DepMap. The box plot presents an interquartile range, and the whiskers show a 95% confidence interval. c Competitive growth assays with Cas9-expressing MOLM-13 cells that express sgRNAs against negative control (NC, negative control), positive control (MYC), and genes involved in the purine biosynthetic pathway over 17 days. The percentages of sgRNA-expressing cells were normalized to those on day 4 after transduction. d Flow cytometry histograms of mature myeloid cell markers CD11b and Gr-1 expression in murine LSCs upon treatment with MPA, MMF, or 6-MP (0.1-1 μM) for 24 h. MPA, mycophenolic acid; 6-MP, 6-mercaptopurine. e Wright–Giemsa staining of LSCs showing myeloid differentiation upon treatment with MMF, MPA, and 6-MP (0.1-1 μM) for 24 h. Scale bar, 20 μm. f Fluorescence images showing engulfment of GFP-labeled Streptococcus agalactiae COH1 by LSC-derived myeloid cells after exposure to MMF (1 μM) for 24 h. Scale bar, 20 μm. g Relative abundance of guanosine mono and dinucleotides in LSCs treated with MMF (0.25 μM) or guanosine (100 μM) alone or in combination for 2 h (n = 5, biologically independent samples). h Mean fluorescence intensity (MFI) of mature myeloid cell marker CD11b (left panel) and Gr-1 (right panel) in LSCs treated with MMF (0.25-0.5 μM) alone or in combination with guanosine (100 μM) for 24 h (n = 3, biologically independent samples). i, j Cell cycle (i) and apoptosis (j) analyses of LSCs upon treatment with MMF (0.25-1 μM) alone or in combination with guanosine (100 μM) for 24 h (n = 3, biologically independent samples). k, l Percentage of BFP (present in sgRNA vector) (k) and MFI of CD11b (l) in Cas9-expressing LSCs after the transduction of sgRNA targeting Rosa26, Impdh1, or Impdh2 genes for 4 days (n = 3, biologically independent samples). m MFI of CD11b in a panel of AML cell lines treated with MMF (0.25-0.5 μM) for 3 days (n = 3, biologically independent samples). n Relative MFI of CD11b in PDX samples treated with MMF (1 μM) for 6 days (n = 3, biological samples). All data are represented as mean ± SD. p values in this figure were calculated by unpaired, two-tailed Student’s t-test (b, l and n) or ANOVA with multiple comparisons analysis using Bonferroni correction post hoc analyses (a, gk and m). See also Supplementary Fig. 3. Source data are provided as a Source Data file.
Fig. 4
Fig. 4. Purine biosynthesis is required for LSC maintenance in vivo.
a Schematic flowchart depicting colony-forming and transplantation assays in LSCs treated with or without MMF. b Representative images of colonies from 6-well plates and individual colonies derived from control and MMF (0.125-0.25 μM)-treated LSCs. Scale bar, 200μm. c Number of colonies derived from LSCs after exposure to MMF treatment (0.125-0.25 μM) during serial plating (n = 3). df Cell number (d), flow cytometry histograms (e), and MFI of myeloid differentiation marker CD11b (f) from the LSC-derived colonies treated with or without MMF (0.125-0.25 μM) after the first plating (n = 3, biologically independent samples). g Kaplan-Meier analysis of survival of recipient mice transplanted with different numbers of LSCs exposed to MMF (0.125 μM) for 12 h ex vivo (n = 5). h Frequency of GFP+ AML cells in the peripheral blood (PB) of recipient mice receiving 104 LSCs after exposure to MMF (0.125 μM) at 16 days post-transplantation (n = 5). i, l Kaplan-Meier analysis of survival of mice transplanted with MLL-AF9-induced AML and treated with either vehicle or MMF (100 mg/kg/day) at days 1 to 14 post-transplantation (i, n = 7) or days 15 to 28 post-transplantation (l, n = 8). j, k, m, n Frequency of GFP+ AML cells (j, m) and MFI of CD11b (k, n) in the PB of AML recipient mice treated with either vehicle or MMF as in (i) (j, k, n = 7) or as in (l) (m, n, n = 8). o, p Kaplan-Meier analysis of survival (o) and estimated frequency of LSCs (p) of MLL-AF9-induced AML mice that were treated with MMF as in (i) (n = 5). q, r Frequency of GFP+ AML cells in the PB (q) and survival analysis (r) of recipient mice transplanted with MLL-AF9+ Mx1-Cre; Impdh2fl/fl AML cells and treated with poly(I:C) at days 5 or 15 after transplantation. s, t Kaplan-Meier analysis of survival (s) and frequency of GFP+ AML cells in PB (t) of secondary recipient mice transplanted with AML cells from moribund mice in (r). u, v Representative flow cytometry dot plots (u) and frequencies of Lin- and HSPCs (v) in the bone marrow of Impdh2 WT (n = 6) and KO (n = 7) mice. All data are represented as mean ± SD. p values in this figure were calculated by unpaired, two-tailed Student’s t-test (h, j, k, m, n, t and v), ANOVA with multiple comparisons analysis using Dunnett’s post hoc analyses (c, d, and f), or log-rank test (g, i, l, o, r and s). See also Supplementary Fig. 4. Source data are provided as a Source Data file.
Fig. 5
Fig. 5. Inhibition of rRNA transcription drives myeloid differentiation of LSCs.
a Isotopic enrichment of GTP and dGTP in murine LSCs treated with 13C6-glucose for 1 and 4 h (n = 3, biological samples). b Relative expression of pre-rRNA and pre-Gapdh in LSCs treated with vehicle, MMF (0.25 μM) or guanosine (100 μM) for 4 h (n = 3, biologically independent samples). c Schematic flowchart created in Biorender and relative abundance of guanosine mono, di, and trinucleotides, AMP/ADP, and lactate (internal control) of LSCs treated with control, CX-5461 (0.1 μM), MMF (0.25 μM), or CX-5461 (0.1 μM) plus MMF (0.25 μM) for 2 h (right panel) (n = 2–3). d, e MFI of myeloid differentiation marker CD11b (left panel) and Gr-1 (right panel) in LSCs treated with CX-5461 (d, 25−250 nM) or BMH-21 (e, 50-500 nM) for 24 h (n = 3, biologically independent samples). f Fluorescence images of THP-1 cells expressing mNeonGreen from the NPM1 locus (NPM1-mNeonGreen) treated with control vehicle, MMF (0.25 μM) or CX-5461 (0.1 μM) for 24 h. Scale bar, 20 μm. All data are represented as mean ± SD. p values in this figure were calculated by unpaired, two-tailed Student’s t-test (a) or ANOVA with multiple comparisons analysis using Bonferroni correction (b and c) or Dunnett’s (d and e) post hoc analyses. See also Supplementary Fig. 5. Source data are provided as a Source Data file.
Fig. 6
Fig. 6. Inhibition of purine biosynthesis reduces LSC gene expression.
a Volcano plot showing the genes downregulated, upregulated, and not significantly affected by MMF treatment in LSCs. Differentially Expressed Genes (DEGs) were identified using adjusted p < 0.05, and log2(fold change) >1 or <−1. b Venn diagrams showing the number of genes downregulated by MMF compared to control, and genes upregulated by MMF plus guanosine compared to MMF treatment alone. c Gene set enrichment analysis (GSEA) plot showing negative enrichment of MLL-AF9 target genes in MMF-treated versus control LSCs. d, e GSEA plots showing positive enrichment of MLL-AF9 target genes (d) and LSC gene signature (e) in LSCs treated with MMF and guanosine versus those treated only with MMF. f Top 30 Gene Ontology (GO) terms for genes downregulated by MMF compared to control, as determined by DAVID functional annotation analysis. g GSEA plot showing negative enrichment of genes directly regulated by MLL-AF9 in CX-5461-treated versus control LSCs. h Volcano plot showing altered chromatin accessibility of LSCs induced by MMF (0.25 μM) treatment for 16 h. i, j Motif analysis of MMF-induced regions with increased (i) and reduced (j) chromatin accessibility in LSCs by ATAC-seq. k Peaks of the altered chromatin accessibility in LSCs induced by MMF, overlapped with or without menin binding. l Meta profiles of ATAC-seq data from control and MMF-treated LSCs near genes downregulated by MMF. m Immunoblots of NF-YA, menin, LEDGF, and GAPDH on separate membranes in LSCs treated with control vehicle, MMF (250-1000 nM) or CX-5461 (25-100 nM) for 16 h. A representative blot from at least two independent experiments is shown. n Immunoblots of menin and LEDGF in LSCs treated with control, MMF (0.5 μM), or CX-5461 (100 nM) for 16 h subjected to immunoprecipitation using either IgG or anti-menin antibodies. *, a non-specific band. A representative blot from at least two independent experiments is shown. o ChIP-qPCR analysis of menin occupation at the Hoxa9 promoter in LSCs treated with control, MMF (500 nM), CX-5461 (100 nM), or VTP-50469 (250 nM) (n = 3, biologically independent samples). p MFI of myeloid differentiation marker CD11b in MOLM-13 cells expressing vector control or 3Ty1-PCE, with or without treatment of VTP-50469 (125 nM), MMF (250 nM), and CX-5461 (100 nM) for 4 days (left panel). Immunoblots on the right show the protein level of 3Ty1-PCE and GAPDH on separate membranes (n = 3, biologically independent samples). q The effects of VTP-50469 (125 nM), MMF (250 nM), and CX-5461 (100 nM) on MOLM-13 cells expressing 3Ty1-PCE after 4 days (n = 3, biologically independent samples). r MFI of myeloid differentiation marker CD11b in THP-1 cells expressing vector control or Hoxa9-p2a-Meis1, with or without treatment of MMF (0.5-1 μM) for 4 days (n = 3, biologically independent samples). All data are represented as mean ± SD. p values in this figure were calculated by permutation test (ce and g), hypergeometric test (f, i and j), unpaired, two-tailed student t-test (p and q) and ANOVA with multiple comparisons analysis using Dunnett’s (o) or Bonferroni correction (p, q and r) post hoc analyses. See also Supplementary Fig. 6. Source data are provided as a Source Data file.
Fig. 7
Fig. 7. Inhibition of purine biosynthesis sensitizes MLLr AML cells to menin inhibitor.
a, b HSA synergy score of MMF plus VTP-50469 (a) and CX-5461 plus VTP-50469 (b) in MOLM-13 cells. A synergy score >10 represents a synergistic effect. c, d HSA synergy score of MMF plus VTP-50469 (c) and CX-5461 plus VTP-50469 (d) in MV4-11 cells. e, f HSA synergy score of MMF plus VTP-50469 (e) and CX-5461 plus VTP-50469 (f) in NB4 cells. g Kaplan-Meier analysis of survival of MLL-AF9-induced AML recipient mice treated with control or ziftomenib (25-100 mg/kg/day) (n = 8-9). h, i Frequency of GFP+ AML cells in PB (h) and survival analysis (i) of AML mice treated with control (n = 10), MMF (100 mg/kg/day) (n = 8), ziftomenib (12.5 mg/kg/day) (n = 10), or a combination of MMF and ziftomenib (n = 11 mice). j Schematic flowchart created with Biorender depicting the AML PDX study with MMF (100 mg/kg/day) and ziftomenib (12.5 mg/kg/day) treatments. k, l Frequency of hCD45+ AML cells in bone marrow of mice transplanted with AML001 (k) (Control n = 4, MMF n = 6, ziftomenib n = 5, and combination n = 5 mice) and AML013 PDX samples (l) (n = 5 mice per group). All data are represented as mean ± SD. p values in this figure were calculated by permutation tests (af) and ANOVA with multiple comparisons analysis using Bonferroni correction post hoc analyses (h, k, and l), or log-rank test (g and i). Source data are provided as a Source Data file.

Similar articles

References

    1. Muntean, A. G. & Hess, J. L. The pathogenesis of mixed-lineage leukemia. Annu Rev. Pathol.7, 283–301 (2012). - PMC - PubMed
    1. Papaemmanuil, E. et al. Genomic classification and prognosis in acute myeloid leukemia. N. Engl. J. Med374, 2209–2221 (2016). - PMC - PubMed
    1. Meyer, C. et al. The MLL recombinome of acute leukemias in 2017. Leukemia10.1038/leu.2017.213 (2017). - PMC - PubMed
    1. Lin, C. et al. AFF4, a component of the ELL/P-TEFb elongation complex and a shared subunit of MLL chimeras, can link transcription elongation to leukemia. Mol. Cell37, 429–437 (2010). - PMC - PubMed
    1. Olsen, S. N. et al. MLL::AF9 degradation induces rapid changes in transcriptional elongation and subsequent loss of an active chromatin landscape. Mol. Cell82, 1140–1155.e1111 (2022). - PMC - PubMed

MeSH terms

Substances

LinkOut - more resources