. 2025 Mar 18;16(1):2684.
doi: 10.1038/s41467-025-57754-1.

A phenopushing platform to identify compounds that alleviate acute hypoxic stress by fast-tracking cellular adaptation

Affiliations

A phenopushing platform to identify compounds that alleviate acute hypoxic stress by fast-tracking cellular adaptation

Li Li et al. Nat Commun. .

Abstract

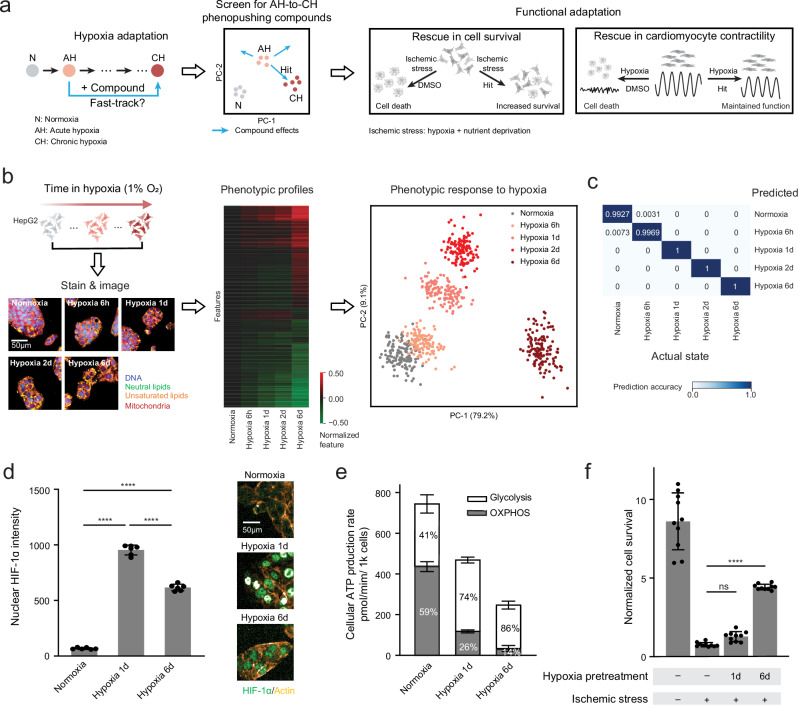
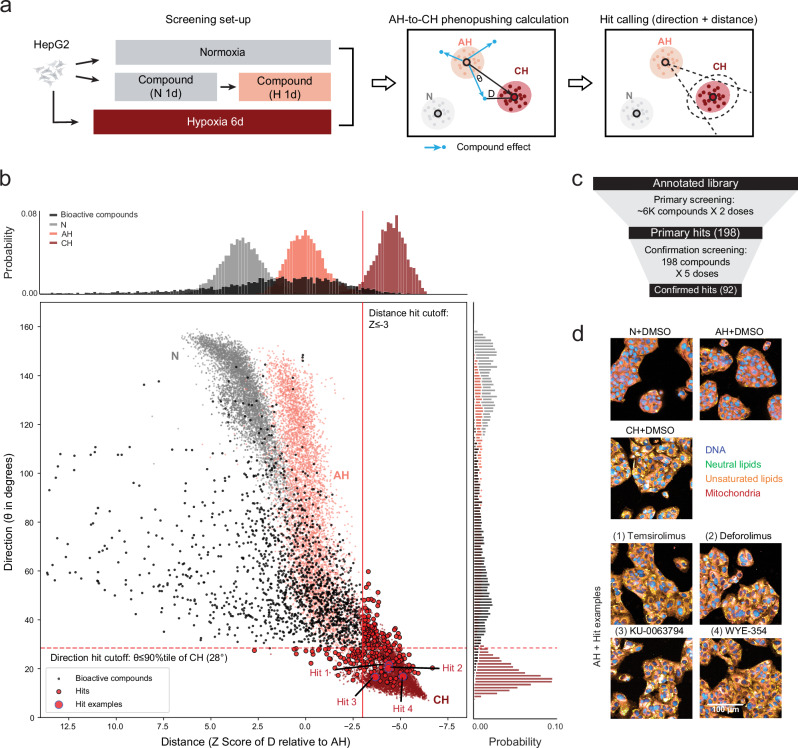
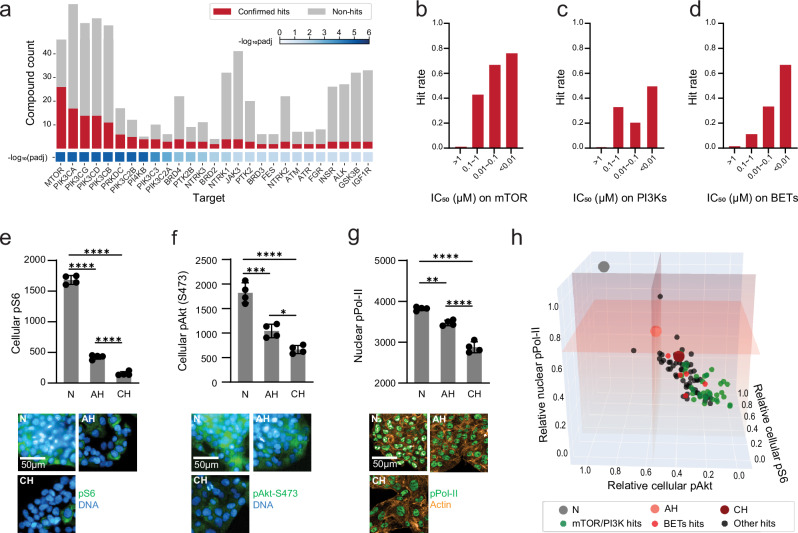
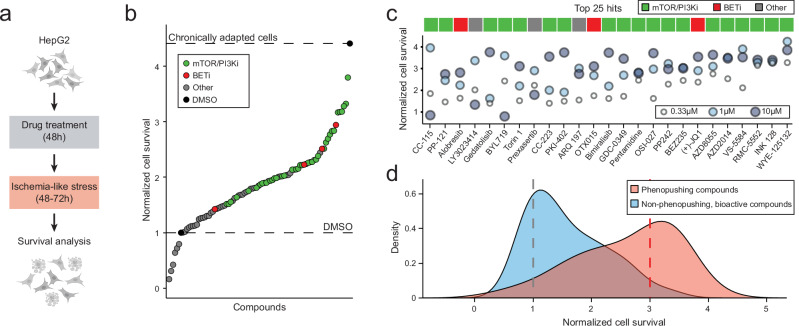
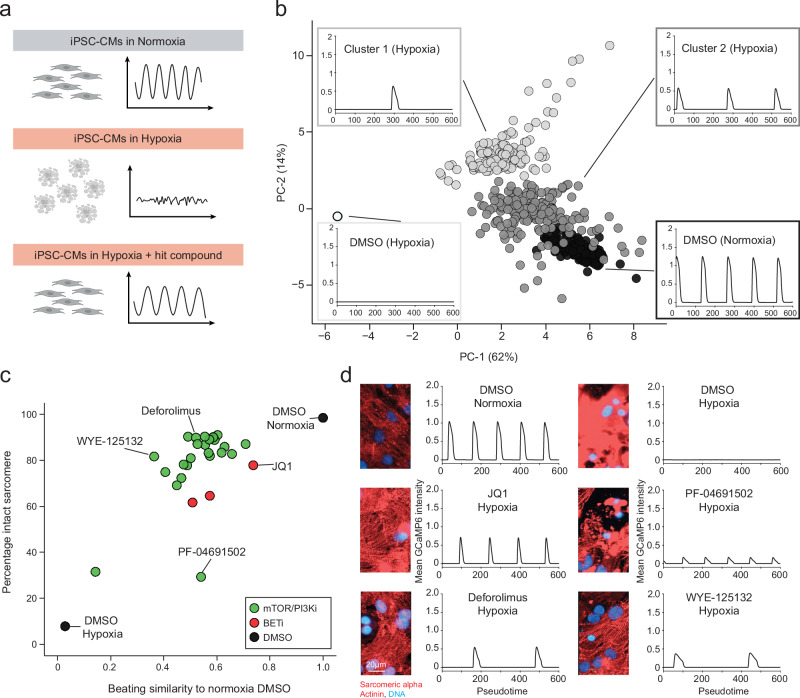
Severe acute hypoxic stress is a major contributor to the pathology of human diseases, including ischemic disorders. Current treatments focus on managing consequences of hypoxia, with few addressing cellular adaptation to low-oxygen environments. Here, we investigate whether accelerating hypoxia adaptation could provide a strategy to alleviate acute hypoxic stress. We develop a high-content phenotypic screening platform to identify compounds that fast-track adaptation to hypoxic stress. Our platform captures a high-dimensional phenotypic hypoxia response trajectory consisting of normoxic, acutely stressed, and chronically adapted cell states. Leveraging this trajectory, we identify compounds that phenotypically shift cells from the acutely stressed state towards the adapted state, revealing mTOR/PI3K or BET inhibition as strategies to induce this phenotypic shift. Importantly, our compound hits promote the survival of liver cells exposed to ischemia-like stress, and rescue cardiomyocytes from hypoxic stress. Our "phenopushing" platform offers a general, target-agnostic approach to identify compounds and targets that accelerate cellular adaptation, applicable across various stress conditions.


Conflict of interest statement

Competing interests: S.J.A., L.F.W., L.L., H.H., S.Q.S., S.H., F.B. are coinventors of US Application No. 63/559,109, a patent application related to the subject matter of this publication, assigned to The Regents of the University of California.

Figures

Fig. 1
Fig. 1. Characterization of cellular states in response to hypoxia in HepG2 cells.
a Schematic overview of our study to identify and validate compounds that fast-track hypoxia adaptation. N: Normoxia. AH: Acute hypoxia. CH: Chronic hypoxia. The cell icons and beating pattern icons: Created in BioRender. Wu, A. (2025) https://BioRender.com/q85j552. b Phenotypic profiling of cellular responses to hypoxia by metabolism-focused biomarkers at different timepoints (6 h, 1 d, 2 d and 6 d). Shown are representative results from 3 independent experiments with similar results. The cell icons: Created in BioRender. Wu, A. (2025) https://BioRender.com/q85j552. c Prediction accuracy for cellular states by kNN. d Nuclear HIF-1α levels in normoxia, hypoxia 1 d, and hypoxia 6 d. Left: mean nuclear HIF-1α per cell measured by immunofluorescence. Right: representative images of HIF-1α immunofluorescence. Data are shown as mean ± SD from 6 biological replicates. One-way ANOVA followed by Tukey’s post hoc test: ****: p < 0.0001. e Normalized ATP production rate from oxidative phosphorylation (OXPHOS) and glycolysis in normoxia, hypoxia 1 d, and hypoxia 6 d. Data are shown as mean ± SD from 6 biological replicates. Two-way ANOVA followed by Tukey’s post hoc test: OXPHOS, P < 0.0001 for N vs Hypoxia 1 d, N vs Hypoxia 6 d, p = 0.0018 for Hypoxia 1 d vs Hypoxia 6 d; glycolysis, p = 0.1137 for N vs Hypoxia 1 d, p = 0.0012 for N vs Hypoxia 6 d, p < 0.0001 for Hypoxia 1 d vs Hypoxia 6 d. f Normalized cell survival under ischemic stress with different pre-treatment conditions. Data are shown as mean ± SD from 10 biological replicates. One-way ANOVA followed by Tukey’s post hoc test: ns: p = 0.6021, ****p < 0.0001. Source data are provided as a Source Data file.
Fig. 2
Fig. 2. Identification of compound hits that phenopush cells from the acute hypoxic state towards the chronic hypoxic state.
a Overview of AH-to-CH phenopushing screening and hit-calling framework. N: Normoxia. AH: Acute hypoxia (1 d). CH: Chronic hypoxia (6 d). D: Distance from the phenotypic profile of a perturbation (a given compound at a given dose) to the centroid of the phenotypic profiles of CH DMSO controls. θ: Angle of deviation from the phenotypic profile of a perturbation relative to the centroid of the phenotypic profiles of CH DMSO controls. The cell icons: Created in BioRender. Wu, A. (2025) https://BioRender.com/q85j552. b Summary of geometric hit calls in the primary screen. Scatter plot and density map for distance (x-axis) and direction (y-axis) of bioactive compounds. Red solid line and dotted line show cutoffs for distance and angle, respectively. Vehicle (DMSO) controls in N, AH, and CH are shown for reference. Bioactive non-hit compounds (black dots), hits (red dots), and four hit examples (large red dots) are shown. c Screening funnel for AH-to-CH phenopushing hits. d Representative images for DMSO under N, AH, or CH compared to hit examples (highlighted in b) in AH (Temsirolimus, Deforolimus, KU-0063794, WYE-354). The experiment was independently repeated three times with similar results. Source data are provided as a Source Data file.
Fig. 3
Fig. 3. mTOR/PI3K and BET proteins are targets for AH-to-CH phenopushing.
a Enriched targets (by gene name) from overrepresentation analysis of hit compounds. Adjusted p values are calculated by hypergeometric distribution overrepresentation analysis followed by Benjamini–Hochberg procedure correction. Bars: hit (red) or non-hit (gray) compound counts per target; Blue squares: adjusted p-values for overrepresentation analysis. bd Hit rates of screened compounds annotated as targeting b mTOR, c PI3Ks and d BET proteins in different potency ranges (represented by IC50). For PI3Ks and BET proteins, the median IC50 across isoforms was used. e Cellular pS6 (at S235/S236), f cellular pAKT (at S473) and g Nuclear pPol II (at S2) in normoxia (N), acute hypoxia (AH, 1 d) and chronic hypoxia (CH, 6 d). Quantification of immunofluorescence intensity (well-level average of per-cell mean intensity) and representative images are shown for e cellular pS6 (at S235/S236), f cellular pAKT (at S473), or g nuclear pPol II (at S2). Data are shown as mean ± SD from 4 biological replicates for eg. One-way ANOVA followed by Tukey’s post hoc test: * in f: p = 0.0149, ** in g: p = 0.001, *** in f: p = 0.0001, **** in eg: p < 0.0001. h Visualization of the effects of confirmed hits in AH on cellular pS6 (at S235/S236) (x-axis), cellular pAKT (at S473) (y-axis) and nuclear pPol II (at S2) (z-axis) based on immunofluorescence intensity (normalized to N DMSO controls). For statistical analyses, see Supplementary Data 4. Source data are provided as a Source Data file.
Fig. 4
Fig. 4. AH-to-CH phenopushing hits rescue cells from ischemia-like stress.
a Overview of the ischemia rescue assay. The cell icons: Created in BioRender. Wu, A. (2025) https://BioRender.com/q85j552. b Scatter plot of hit compound effects on HepG2 survival in ischemia-like stress. Cell survival: normalized to DMSO-treated cells, averaged across all tested well replicates and doses for each drug, and ranked based on their survival rate. Dashed lines: survival of DMSO-treated hypoxia naïve cells (bottom) or DMSO-treated cells pre-exposed to hypoxia for 6 days (top). mTOR/PI3Ki: AH-to-CH phenopushing hits targeting mTOR and/or PI3Ks. BETi: AH-to-CH phenopushing hits targeting BET proteins. Other: AH-to-CH phenopushing hits other than mTOR/PI3Ki and BET proteins. c Normalized cell survival of each tested dose for the top 25 hits shown in b. d Ischemia rescue effect comparison between the most effective tested dose of phenopushing (red) and non-phenopushing, bioactive (blue) compounds. Kernel density estimation used to smooth histograms. Dashed lines: (grey) mean survival of DMSO-treated cells or (red) 3x DMSO survival. Source data are provided as a Source Data file.
Fig. 5
Fig. 5. AH-to-CH phenopushing hits rescue iPSC-CMs from acute hypoxic stress.
a Overview of the cardiomyocyte rescue assay. The cell icons and beating pattern icons: Created in BioRender. Wu, A. (2025) https://BioRender.com/q85j552. b Survey of phenopushing hit effects on iPSC-CM beating in hypoxia. Beating patterns of iPSC-CMs over the time frame (~20 s) are visualized using principal component analysis. Dot: drug-dose replicate. Colors: (white) 0 beats; (Cluster 1: light grey) 1 beat per time frame; (Cluster 2: dark grey) > 1 beats per time frame; and (black) DMSO normoxia. Representative beating traces for each cluster are shown. c Hit compounds in Cluster 2 rescue beating behaviors as well as sarcomere structures of iPSC-CMs in hypoxia. Scatter plot of beating similarity compared to normoxia DMSO (x-axis) and percentage of intact sarcomere structure (y-axis) for all compounds in Cluster 2 shown in b. Dots: average over all replicates for each dose. mTOR/PI3Ki: AH-to-CH phenopushing hits targeting mTOR and/or PI3Ks. BETi: AH-to-CH phenopushing hits targeting BET proteins. d Representative immunofluorescence images of sarcomere structure (sarcomeric α-actinin) and corresponding beating traces for selected hits shown in c. The experiment was independently repeated three times with similar results. Source data are provided as a Source Data file.

Similar articles

Cited by

References

    1. Wilson, J. W., Shakir, D., Batie, M., Frost, M. & Rocha, S. Oxygen-sensing mechanisms in cells. FEBS J.287, 3888–3906 (2020). - PubMed
    1. Hammarlund, E. U., Flashman, E., Mohlin, S. & Licausi, F. Oxygen-sensing mechanisms across eukaryotic kingdoms and their roles in complex multicellularity. Science370, eaba3512 (2020). - PubMed
    1. Lee, J. W., Ko, J., Ju, C. & Eltzschig, H. K. Hypoxia signaling in human diseases and therapeutic targets. Exp. Mol. Med.51, 1–13 (2019). - PMC - PubMed
    1. Luo, Z. et al. Hypoxia signaling in human health and diseases: implications and prospects for therapeutics. Signal Transduct. Target. Ther.7, 218 (2022). - PMC - PubMed
    1. Lee, P., Chandel, N. S. & Simon, M. C. Cellular adaptation to hypoxia through hypoxia inducible factors and beyond. Nat. Rev. Mol. Cell Biol.21, 268–283 (2020). - PMC - PubMed

MeSH terms

Substances