. 2025 Mar 19;13(1):39.
doi: 10.1038/s41413-025-00405-4.

Bone marrow adipogenic lineage precursors are the major regulator of bone resorption in adult mice

Affiliations

Bone marrow adipogenic lineage precursors are the major regulator of bone resorption in adult mice

Jiawei Lu et al. Bone Res. .

Abstract

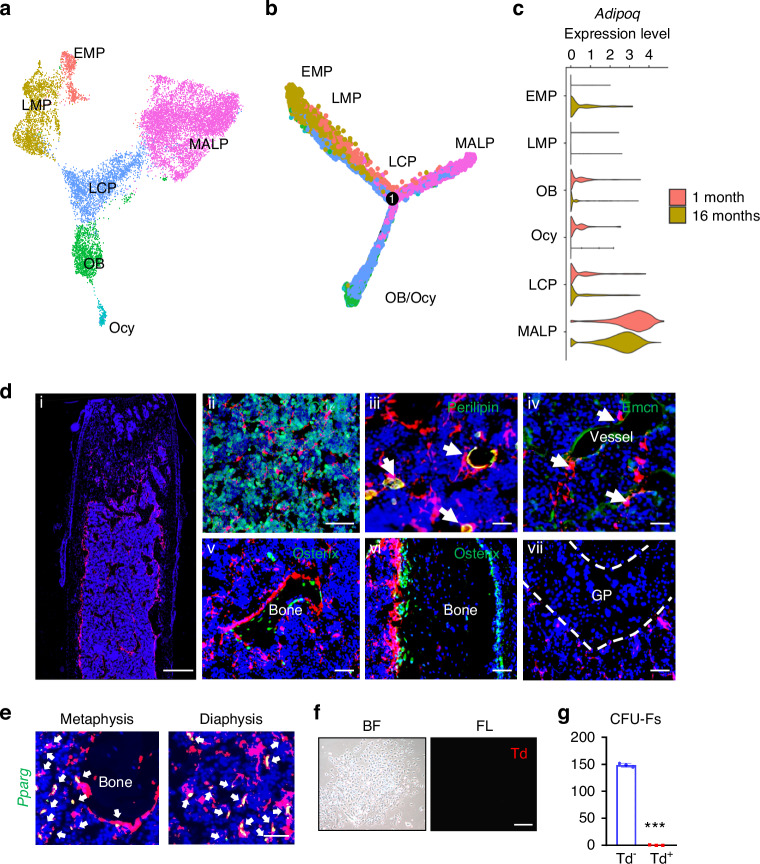
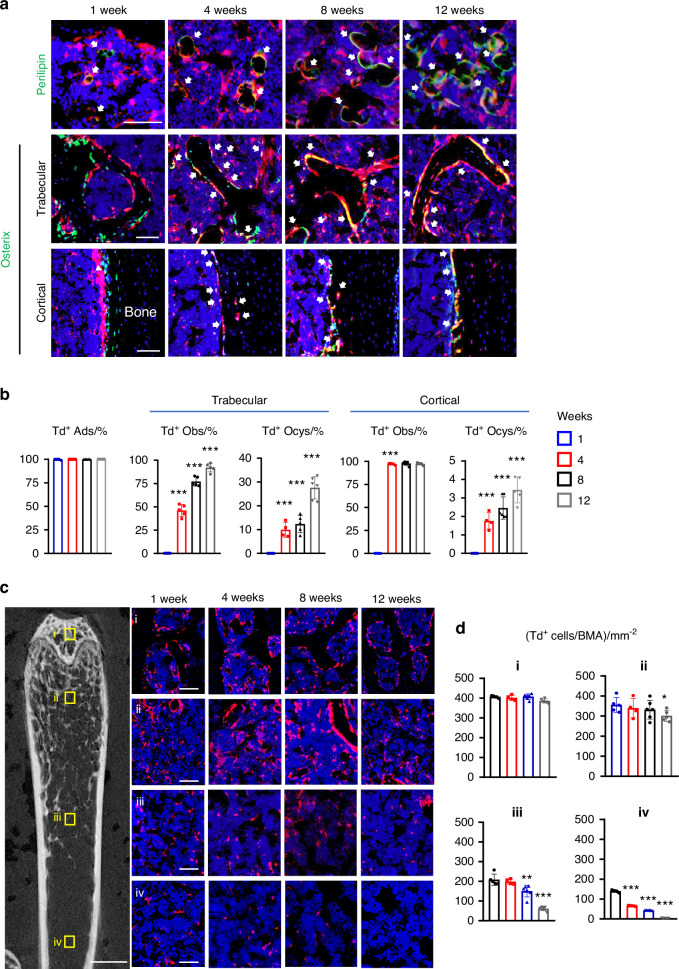
Bone resorption by osteoclasts is a critical step in bone remodeling, a process important for maintaining bone homeostasis and repairing injured bone. We previously identified a bone marrow mesenchymal subpopulation, marrow adipogenic lineage precursors (MALPs), and showed that its production of RANKL stimulates bone resorption in young mice using Adipoq-Cre. To exclude developmental defects and to investigate the role of MALPs-derived RANKL in adult bone, we generated inducible reporter mice (Adipoq-CreER Tomato) and RANKL deficient mice (Adipoq-CreER RANKLflox/flox, iCKO). Single cell-RNA sequencing data analysis and lineage tracing revealed that Adipoq+ cells contain not only MALPs but also some mesenchymal progenitors capable of osteogenic differentiation. In situ hybridization showed that RANKL mRNA is only detected in MALPs, but not in osteogenic cells. RANKL deficiency in MALPs induced at 3 months of age rapidly increased trabecular bone mass in long bones as well as vertebrae due to diminished bone resorption but had no effect on the cortical bone. Ovariectomy (OVX) induced trabecular bone loss at both sites. RANKL depletion either before OVX or at 6 weeks post OVX protected and restored trabecular bone mass. Furthermore, bone healing after drill-hole injury was delayed in iCKO mice. Together, our findings demonstrate that MALPs play a dominant role in controlling trabecular bone resorption and that RANKL from MALPs is essential for trabecular bone turnover in adult bone homeostasis, postmenopausal bone loss, and injury repair.


Conflict of interest statement

Competing interests: The authors declare no competing interests.

Figures

Fig. 1
Fig. 1
Adipoq labels MALPs in adult mice. a The integrated scRNA-seq dataset of sorted bone marrow Td+ cells from 1 and 16-month-old Col2-Cre Td mice. The Uniform Manifold Approximation and Projection (UMAP) plot is presented to show cell clustering. EMP early mesenchymal progenitor, LMP late mesenchymal progenitor, LCP lineage committed progenitor, OB osteoblast, Ocy osteocyte, MALP marrow adipogenic lineage precursor. b Monocle trajectory plot of bone marrow mesenchymal lineage cells. Cells are labeled according to their Seurat clusters. c Violin plot of Adipoq in bone marrow mesenchymal cells in young and old mice. d Representative fluorescent images of AdipoqER/Td mouse femur reveal many bone marrow Td+ cells. Mice at 3 months of age received Tam injections for 3 days and their bones were harvested at day 7. (i) A low magnification image of a distal femur. Scale bar = 500 μm. (ii–vii) At a high magnification, Td labels CD45- stromal cells (ii), Perilipin+ adipocytes (arrows, iii), and pericytes (arrows, iv), but does not label osteoblasts and osteocytes (v, vi) and growth plate (GP) chondrocytes (vii). Scale bar = 50 μm. e Fluorescent images of AdipoqER/Td mouse bone marrow stained for Pparg mRNA by RNA FISH. Scale bar=20 μm. f CFU-F assay of bone marrow cells from AdipoqER/Td mice shows that all CFU-F colonies are made of Td- cells. BF: brightfield; FL: fluorescent light. Scale bar=50 μm. g Quantification of Td+ and Td CFU-F colonies formed from 3 million bone marrow cells. ***P < 0.001 vs Td- CFU-Fs, n = 3 mice
Fig. 2
Fig. 2
Adipoq also labels some late, bipotent mesenchymal progenitors. a Fluorescent images of AdipoqER/Td mouse bone marrow stained for Perilipin or Osterix protein. Mice at 3 months of age received Tam injections for 3 days and their femurs were harvested at 1, 4, 8 and 12 weeks later. In the top panel, arrows point to mature adipocytes. In the middle (trabecular bone) and bottom (cortical bone) panels, arrows point to Osterix+Td+ cells. Scale bar = 50 μm. b Percentages of Td+ cells in adipocytes (ADs), osteoblasts (OBs), and osteocytes (Ocys) were quantified over the tracing period. n = 4–6 mice/time point. c Fluorescent images of AdipoqER/Td bone marrow to show location-dependent change of Td+ cells during tracing. The left panel is a representative 2D microCT image of femur to show 4 areas for quantification. Scale bar = 1 mm. Their corresponding areas in the fluorescent images during the tracing period are shown at the right. i: subchondral bone; ii: top metaphysis; iii: bottom metaphysis; iv: diaphysis (scale bar = 50 μm). d Quantification of Td+ cells per bone marrow area (BMA) in 4 areas. *P < 0.05; **P < 0.01; ***P < 0.001 vs 1 week, n = 5 mice/time point
Fig. 3
Fig. 3
MALPs are the major source of osteoclast regulatory factors in bone marrow. a UMAP plot of mesenchymal subpopulations in human bone marrow. Bone samples were collected from femoral heads after hip replacement surgery. b Dot plot of TNFSF11, CSF1, THY1 and adipogenic markers in mesenchymal subpopulations. c Fluorescent images of AdipoqER/Td mouse bone marrow stained for Rankl mRNA by RNA FISH. White arrows: Rankl+ Td+ cells; orange arrows: Osteocytes. Scale bar = 20 μm. d Fluorescent images of bone marrow co-stained for Pparg and Rankl mRNA by RNA FISH. White arrows: Rankl+Ppagr+ cells; orange arrows: osteocytes. Scale bar = 20 μm. e Fluorescent images of AdipoqER/Td mouse bone marrow stained for Csf1 mRNA by RNA FISH. White arrows: Csf1+ Td+ cells; orange arrows: osteocytes. Scale bar = 20 μm
Fig. 4
Fig. 4
Depletion of RANKL in MALPs increases long bone trabecular bone mass in adult mice by suppressing bone resorption. a qRT-PCR analysis of Rankl mRNA in bone marrow and cortical bone from WT and RANKL iCKO mice at 4 weeks after Tam injection. Mice received Tam at 3 months of age. n = 3 mice/group. b ELISA analysis of RANKL in bone marrow from WT and RANKL iCKO mice at 2 weeks after Tam injection. Mice received Tam at 3 months of age. n = 3 mice/group. c 3D microCT reconstruction of whole femurs from WT and iCKO mice at 1 month after Tam injection. Scale bar = 1 mm. d 3D microCT reconstruction reveals a drastic increase of femoral trabecular bone. Scale bar = 200 µm. e MicroCT measurement of trabecular bone structural parameters. BV/TV bone volume fraction, Tb.N trabecular number, Tb.Th trabecular thickness, Tb.Sp trabecular separation. f Representative TRAP staining images show TRAP+ osteoclast (arrows) at different skeletal sites: secondary spongiosa (SS), chondro-osseous junction (COJ), and endosteal surface (Endo.S). Scale bar = 50 μm. g Quantification of osteoclast surface (Oc.S) at 3 skeletal sites. BS bone surface, L COJ length. h Representative Osterix staining of trabecular bone from WT and RANKL iCKO femurs. Scale bar = 50 μm. i Quantification of osteoblast surface (OB.S). j Representative double labeling of trabecular bone from WT and iCKO femurs. Scale bar = 20 μm. k Bone formation activity is quantified. MAR mineral apposition rate, MS mineralizing surface, BFR bone formation rate. l Serum ELISA analysis of bone resorption marker (CTX-1) and formation marker (P1NP) in WT and iCKO mice. *P < 0.05; **P < 0.01; ***P < 0.001 vs WT, n = 5–6 mice/group
Fig. 5
Fig. 5
RANKL deficiency in MALPs protects adult female mice from ovariectomy-induced trabecular bone loss. a 3D microCT reconstruction of femoral trabecular bone from WT and RANKL iCKO mice at 6 weeks post OVX surgery. Mice received Tam injections at 3 months of age right before the surgery. Scale bar = 200 µm. b MicroCT measurement of trabecular bone structural parameters. c Representative TRAP staining images of trabecular bone from WT and RANKL iCKO femurs show TRAP+ osteoclasts (arrows). Scale bar = 50 μm. d Quantification of osteoclast surface (Oc.S). e Representative Osterix staining of trabecular bone from WT and RANKL iCKO femurs. Scale bar = 50 μm. f Quantification of osteoblast surface (OB.S). g Bone formation activity is quantified. h Serum ELISA analysis of bone resorption marker (CTX-1) and formation marker (P1NP) in WT and iCKO mice. i Representative H&E staining of trabecular bone from WT and RANKL iCKO femurs. Scale bar = 50 μm. j Quantification of the percentage of adipocyte area within bone marrow and adipocyte size. #P < 0.05; ##P < 0.01; ###P < 0.001 OVX vs Sham; *P < 0.05; **P < 0.01; ***P < 0.001 iCKO vs WT, n = 5–6 mice/group
Fig. 6
Fig. 6
Depleting RANKL in MALPs in osteoporotic mice restores trabecular bone mass. a 3D microCT reconstruction of femoral trabecular bone from WT and RANKL iCKO mice at 10 weeks post OVX surgery. Mice received the surgery at 3 months of age and vehicle or Tam injections 6 weeks later. Scale bar = 200 µm. b MicroCT measurement of trabecular bone structural parameters. c Representative TRAP staining images of femoral trabecular bone from WT and RANKL iCKO mice with vehicle or Tam injections show TRAP+ osteoclasts (arrows). Scale bar = 50 μm. d Quantification of osteoclast surface (Oc.S). e Representative Osterix staining of femoral trabecular bone from WT and RANKL iCKO mice with vehicle or Tam injections. Scale bar = 50 μm. f Quantification of osteoblast surface (OB.S). g Bone formation activity is quantified. h Serum ELISA analysis of bone resorption marker (CTX-1) and formation marker (P1NP) in WT and iCKO mice with vehicle or Tam injections. #P < 0.05; ##P < 0.01; ##P < 0.001 Tam vs Veh; *P < 0.05; **P < 0.01; ***P < 0.001 iCKO vs WT, n = 5–6 mice/group
Fig. 7
Fig. 7
Bone healing is delayed in mice with RANKL depletion in MALPs. a Representative sagittal (top) and transverse (bottom) cross-sections of microCT images of drill-hole defects in WT and RANKL iCKO mice. Mice received Tam injections at 3 months of age followed by drill hole injury. Femurs were harvested at 4 weeks later for examination. Arrows point to the defect region. Yellow and red dashed squares indicate the areas for quantification of intramedullary and cortical defect regions, respectively. Scale bar = 1 mm. b Quantification of bone volume fraction at intramedullary (IM) and cortical defect regions. c Representative TRAP staining images of bone at intramedullary and cortical defect regions from WT and RANKL iCKO mice to show TRAP+ osteoclasts (arrows). Scale bar = 20 μm. d Quantification of osteoclast surface (Oc.S). e Representative Osterix staining of bone at intramedullary and cortical defect regions from WT and RANKL iCKO mice. Scale bar = 20 μm. f Quantification of osteoblast surface (OB.S). ***P < 0.001 vs WT, n = 5 mice/group

Update of

References

    1. Bolamperti, S., Villa, I. & Rubinacci, A. Bone remodeling: an operational process ensuring survival and bone mechanical competence. Bone Res.10, 48 (2022). - PMC - PubMed
    1. Schindeler, A., McDonald, M. M., Bokko, P. & Little, D. G. Bone remodeling during fracture repair: the cellular picture. Semin. Cell Dev. Biol.19, 459–466 (2008). - PubMed
    1. Veis, D. J. & O’Brien, C. A. Osteoclasts, master sculptors of bone. Annu. Rev. Pathol.18, 257–281 (2023). - PubMed
    1. Soysa, N. S. & Alles, N. Positive and negative regulators of osteoclast apoptosis. Bone Rep.11, 100225 (2019). - PMC - PubMed
    1. Yahara, Y. et al. Erythromyeloid progenitors give rise to a population of osteoclasts that contribute to bone homeostasis and repair. Nat. Cell Biol.22, 49–59 (2020). - PMC - PubMed

LinkOut - more resources