. 2025 Mar 18;16(1):2658.
doi: 10.1038/s41467-025-57765-y.

Metabolomics strategy for diagnosing urinary tract infections

Affiliations

Metabolomics strategy for diagnosing urinary tract infections

Carly C Y Chan et al. Nat Commun. .

Abstract

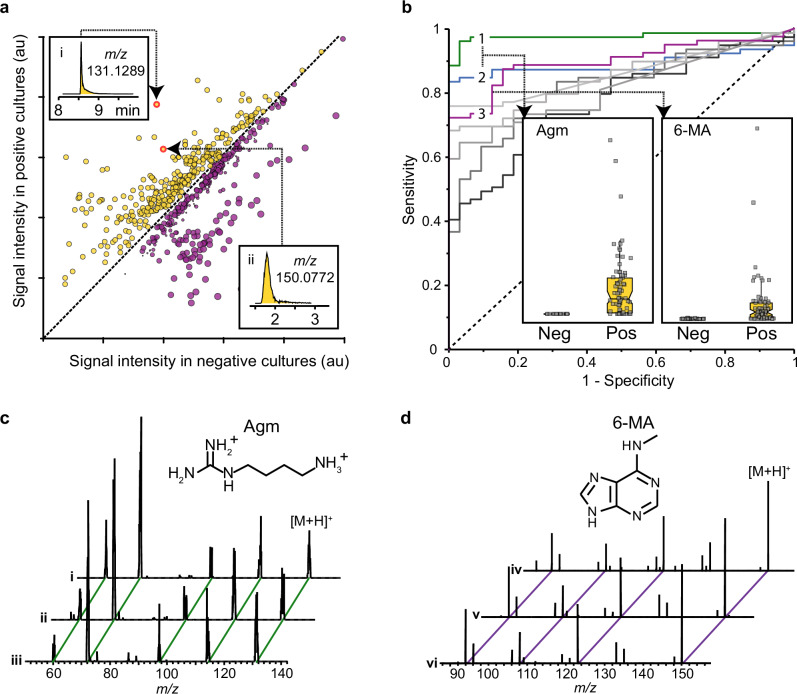
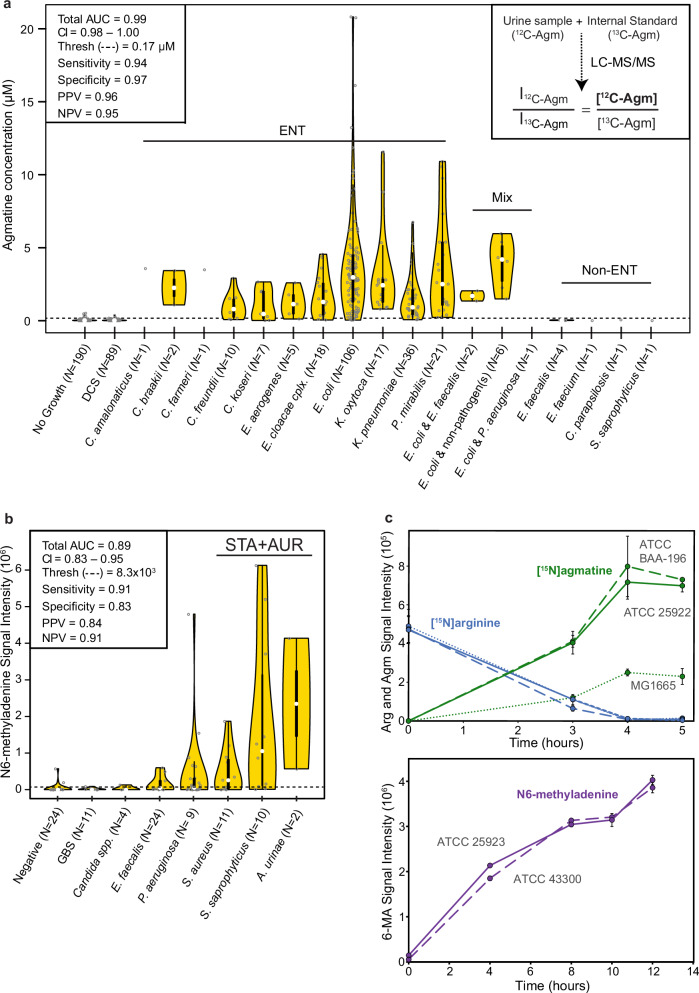
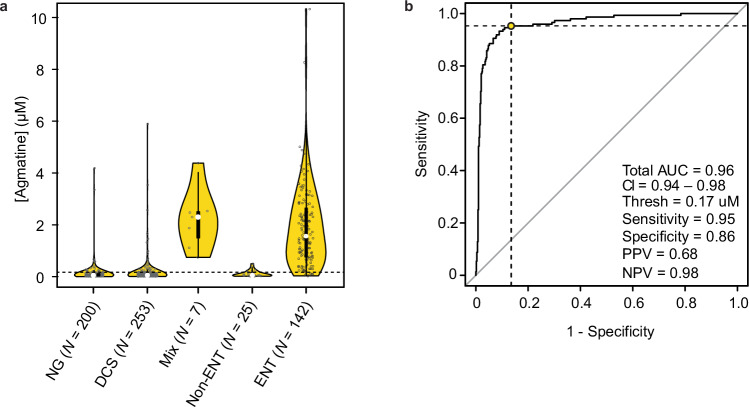
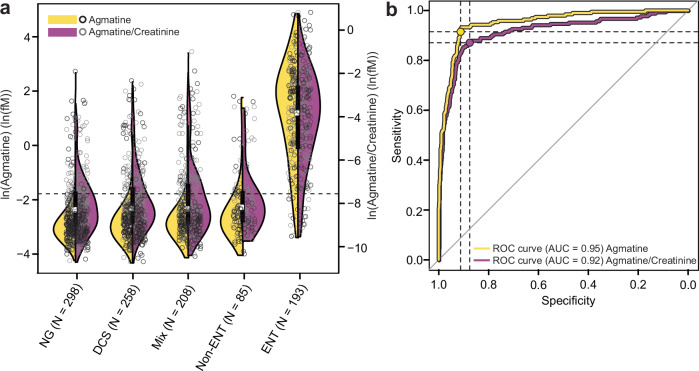
Metabolomics has emerged as a mainstream approach for investigating complex metabolic phenotypes but has yet to be integrated into routine clinical diagnostics. Metabolomics-based diagnosis of urinary tract infections (UTIs) is a logical application of this technology since microbial waste products are concentrated in the bladder and thus could be suitable markers of infection. We conducted an untargeted metabolomics screen of clinical specimens from patients with suspected UTIs and identified two metabolites, agmatine, and N6-methyladenine, that are predictive of culture-positive samples. We developed a 3.2-min LC-MS assay to quantify these metabolites and showed that agmatine and N6-methyladenine correctly identify UTIs caused by 13 Enterobacterales species and 3 non-Enterobacterales species, accounting for over 90% of infections (agmatine AUC > 0.95; N6-methyladenine AUC > 0.89). These markers were robust predictors across two blinded cohorts totaling 1629 patient samples. These findings demonstrate the potential utility of metabolomics in clinical diagnostics for rapidly detecting UTIs.


Conflict of interest statement

Competing interests: Drs. Lewis, Gregson, and Mr. Groves are authors of a patent relating to the use of LC-MS for detecting urinary tract infections. These authors have a relationship with Rapid Infection Diagnostics Inc., a company that is developing commercial microbiology diagnostic tools. No other competing interests were declared.

Figures

Fig. 1
Fig. 1. Discovery of agmatine and N6-methyladenine as UTI biomarkers.
a LC-MS data were acquired from metabolites predictive of culture-positive (yellow points) and culture-negative (purple points) urine samples. Potential UTI biomarkers were identified (m/z 131.1289 and m/z 150.0772 shown as examples; see inset for chromatogram). b Predictive UTI biomarkers were ranked according to receiver operating characteristic curves. Signal 1 (m/z 114.1025) and signal 2 (m/z 131.1289) were assigned to agmatine, and signal 3 (m/z 150.0771) was assigned to N6-methyladenine. c Agmatine and d N6-methyladenine assignments were verified by tandem LC-MS/MS fragmentation patterns observed in a culture-positive urine sample (i, iv), an analytical standard of the target molecule (ii; 250 nM, v; 50 µM), and a standard added to a culture-negative urine sample at the same concentration (iii, vi). Agm agmatine, 6-MA N6-methyladenine, Neg growth-negative urine, Pos growth-positive urine.
Fig. 2
Fig. 2. Microbial metabolite signals differentiate Enterobacterales and certain non-Enterobacterales positive urines from controls.
a Violin plot of agmatine concentrations in urine samples determined by spike-in of stable isotope-labeled internal standard following SPE (see inset). White dots indicate median values, thick black bars indicate interquartile ranges, and thin black lines indicate 3× interquartile hinge points. b Violin plot of N6-methyladenine signal intensities from a prospectively collected non-Enterobacterales cohort of patient urine samples. White dots indicate median values, thick black bars indicate interquartile ranges, and thin black lines indicate 3× interquartile hinge points. c E. coli (three different strains, indicated respectively by solid, dashed, and dotted lines) were grown in sterile urine (top panel) spiked with [15N2]arginine (blue) for 8 h and were monitored for [15N2]agmatine production (green). S. aureus (two different strains, indicated respectively by solid and dashed lines) were grown in sterile urine (bottom) for 12 h and were monitored for N6-methyladenine production (purple). In both graphs, data are presented as mean values, +/− standard deviation of technical replicates (E. coli = 3; S. aureus = 2) taken from each separate culture. Agm agmatine, AUC area under curve, CI confidence interval, Thresh threshold, PPV positive predictive value, NPV negative predictive value, DCS doubtful clinical significance, Non-ENT non-Enterobacterales, ENT Enterobacterales, STA Staphylococcus species, AUR Aerococcus urinae, Arg arginine, 6MA N6-methyladenine, GBS group B streptococcus. Source data are provided in the Source Data file.
Fig. 3
Fig. 3. Blinded performance trial of clinically adapted metabolomics-based UTI diagnostics.
a Agmatine concentrations in a blinded cohort of clinical urine samples. Categories on the x-axis represent calls from traditional microbiology analysis performed at a regional diagnostic lab. White dots indicate median values, thick black bars indicate interquartile ranges, and thin black lines indicate 3× interquartile hinge points. b Receiver operating characteristic curve demonstrating the performance of agmatine as a diagnostic marker for Enterobacterales in a blinded, prospective trial. Sensitivity and specificity for 0.17 μM threshold is represented by the yellow dot. NG no growth, DCS doubtful clinical significance, non-ENT non-Enterobacterales, ENT Enterobacterales, Mix polymicrobial cultures containing at least one Enterobacterales member, AUC area under curve, CI confidence interval, Thresh threshold, PPV positive predictive value, NPV negative predictive value. Source data are provided in the Source Data file.
Fig. 4
Fig. 4. Creatinine normalized agmatine concentrations in a blinded cohort of urine specimens.
a Violin plot of agmatine concentrations compared to creatinine normalized agmatine concentrations. White dots indicate median values, thick black bars indicate interquartile ranges, and thin black lines indicate 3× interquartile hinge points. b Receiver operating characteristic curves demonstrating the equivalence between detected agmatine levels and creatinine normalized agmatine levels. Sensitivity and specificity were calculated for the 0.17 μM threshold. NG no growth, DCS doubtful clinical significance, non-ENT non-Enterobacterales, ENT Enterobacterales, Mix polymicrobial cultures containing at least one Enterobacterales member, ROC receiver operating characteristic, AUC area under curve. Source data are provided in the Source Data file.

Similar articles

Cited by

References

    1. Fernández-García, M., Rojo, D., Rey-Stolle, F., García, A. & Barbas, C. Metabolomic-based methods in diagnosis and monitoring infection progression. In: Metabolic Interaction in Infection (eds. Silvestre, R. & Torrado, E.) 283–315 (Springer International Publishing, Cham, 2018). 10.1007/978-3-319-74932-7_7. - PMC - PubMed
    1. Satink, H. P. W. M. et al. Microbial influences on urinary polyamine excretion. Clin. Chim. Acta179, 305–314 (1989). - PubMed
    1. Lussu, M. et al. 1H NMR spectroscopy-based metabolomics analysis for the diagnosis of symptomatic E. coli-associated urinary tract infection (UTI). BMC Microbiol17, 201 (2017). - PMC - PubMed
    1. Bower, J. M. & Mulvey, M. A. Polyamine-mediated resistance of uropathogenic Escherichiacoli to nitrosative stress. J. Bacteriol.188, 928–933 (2006). - PMC - PubMed
    1. Puebla-Barragan, S., Renaud, J., Sumarah, M. & Reid, G. Malodorous biogenic amines in Escherichiacoli-caused urinary tract infections in women—a metabolomics approach. Sci. Rep.10, 9703 (2020). - PMC - PubMed

LinkOut - more resources