. 2025 Mar 18;15(1):9250.
doi: 10.1038/s41598-025-93650-w.

Identification of methionine metabolism related prognostic model and tumor suppressive functions of BHMT in hepatocellular carcinoma

Affiliations

Identification of methionine metabolism related prognostic model and tumor suppressive functions of BHMT in hepatocellular carcinoma

Wenli Liu et al. Sci Rep. .

Abstract

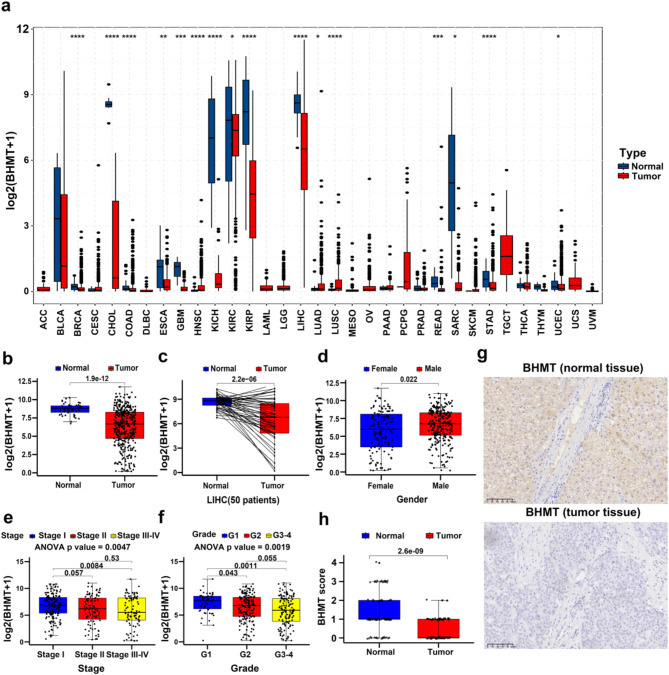
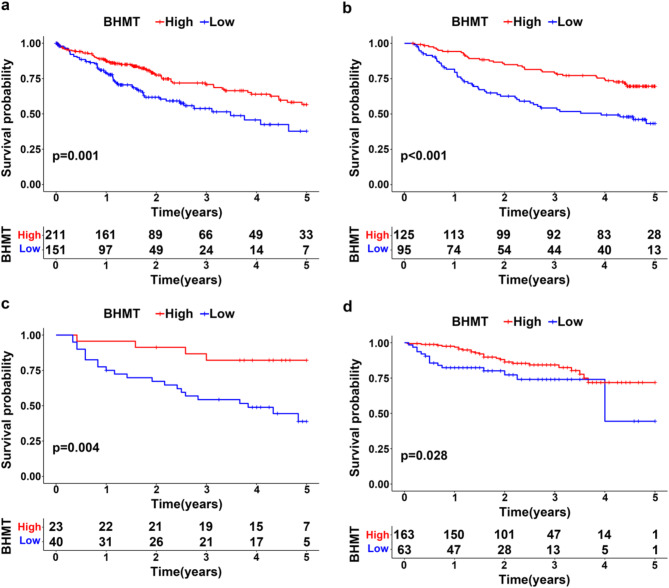
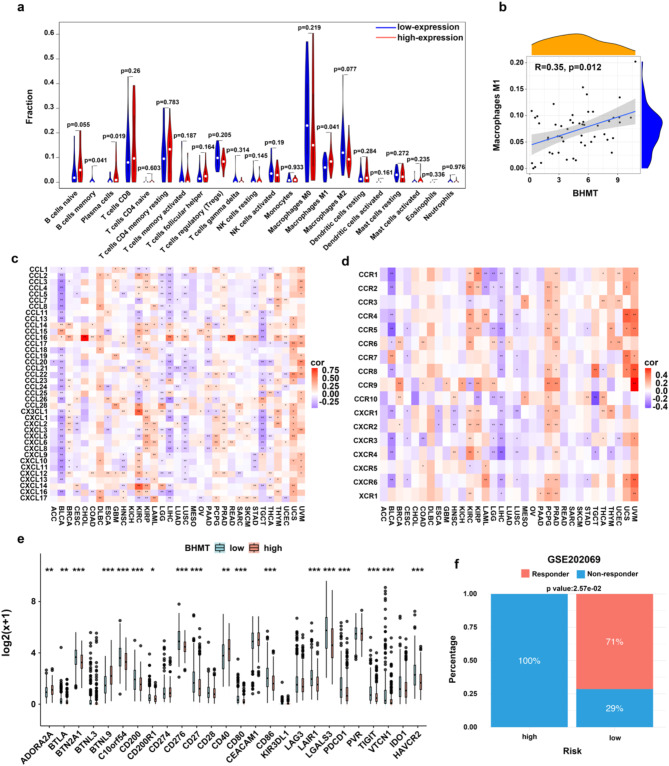
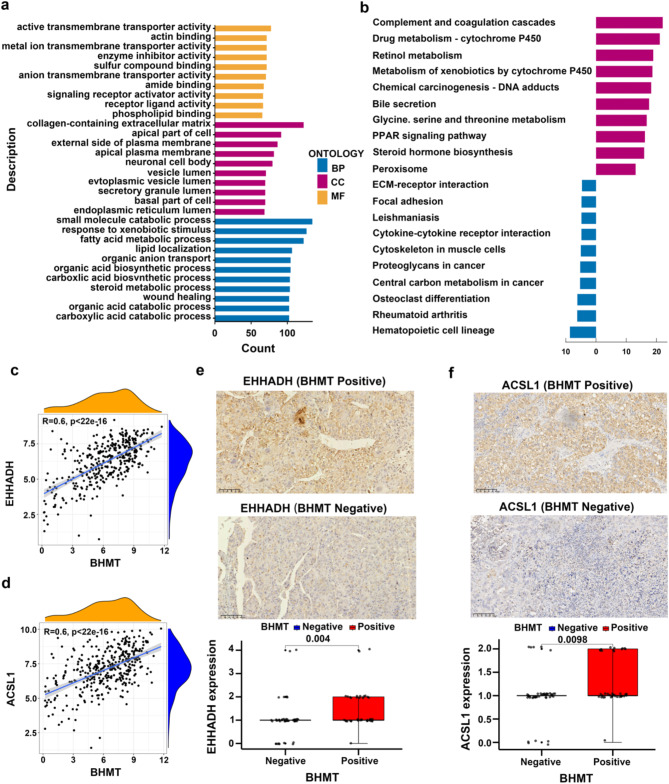
Given the resistance to conventional treatments and limitations of immune checkpoint blockade therapy in hepatocellular carcinoma (HCC), it is imperative to explore novel prognostic models and biomarkers. The dependence of cancer cell on exogenous methionine, known as Hoffman effect, is a hallmark of HCC, with numerous studies reporting a strong correlation between methionine metabolism and tumor development. Betaine-homocysteine S-methyltransferase (BHMT), a critical component of methionine metabolism pathway, has polymorphisms linking to poor prognosis in multiple cancers. Nevertheless, there is little literature regarding the relationship between methionine metabolism and incidence, mortality of HCC, as well as the function of BHMT in HCC progression. In this study, by analyzing multiple datasets, we constructed a methionine metabolism-related prognostic model and thoroughly investigated the influence of BHMT on the prognosis of HCC. Bioinformatics analysis revealed a marked decrease in BHMT expression in HCC, which was linked to adverse clinical outcomes. CIBERSORT results suggest that BHMT promotes infiltration of M1 macrophages. Our results suggest its potential as an ideal prognostic biomarker for anti PD-L1 immunotherapy. In summary, this study innovatively provides first methionine metabolism-related prognostic model and unveils the tumor suppressive function of BHMT in HCC, providing potential mechanism by which BHMT exert its function.

Keywords: BHMT; Hepatocellular carcinoma; Immunotherapy; Lipid metabolism; Methionine metabolism; Tumor microenvironment.


Conflict of interest statement

Declarations. Competing interests: The authors declare no competing interests.

Figures

Fig. 1
Fig. 1
Overall design of the study.
Fig. 2
Fig. 2
Construction of a Prognostic Model Related to Methionine Metabolism. Volcano plot (a) illustrate differential analysis of tumor and normal samples from TCGA and GTEx, generating 1239 regulated genes and 1506 downregulated genes. Downregulated genes were utilized to perform metabolism associated KEGG pathway enrichment analysis (b). The ratio is defined as the proportion of pathway genes present among the differentially expressed genes relative to the total number of genes in the pathway geneset. With thirteen candidate genes generated by intersection of genes from methionine and cysteine pathway geneset and differentially expressed genes between tumor and normal samples, thirty machine learning algorithms were employed to construct the model, which was ranked based on the average C-index across datasets (c). Forest plot shows the results of univariant (d) and multivariant (e) Cox regression analysis with predict scores of prognostic model based on transcriptomics generated by algorithm ‘RSF + SuperPC’, and clinical indicators. In panel d, clinical indicators include stage, gender, age, and HBV infectious status, while in panel e, clinical indicators include stage and HBV infectious status. The nomogram (f) predicts 1-year, 2-year, and 5-year survival outcomes in TCGA-LIHC.
Fig. 3
Fig. 3
Functional Validation of the Prognostic Model. Samples were divided into high and low-risk groups based on the median model prediction score, and Kaplan-Meier survival curve analysis was performed for TCGA-LIHC (a) and GSE14520-GPL571 (b). To further evaluate the prognostic value of the model, time-dependent ROC curves were plotted for the model scores in the aforementioned datasets (c-d).
Fig. 4
Fig. 4
Expression of BHMT in HCC. The ‘TCGAplot’ R package was used to depict the expression levels of BHMT in pan-cancer tissues, contrasting tumor with normal tissues (a). Within TCGA-LIHC, expression levels of BHMT were analyzed in all (b) and paired (c) tumor versus normal samples. Besides, BHMT expression among different Gender (d), Stage (e) and Grade (f) patients were analyzed. Immunohistochemical detection of BHMT expression in cancerous and adjacent normal tissues (g) and box plot comparing BHMT scores between the normal group and the tumor group is presented in penal h. The scale bar represents 100 μm.
Fig. 5
Fig. 5
The prognostic implication of BHMT in HCC. Kaplan-Meier survival curve analyses highlighted differences in OS between patients with high and low BHMT expression in the TCGA-LIHC (a), GSE14520_GPL3921 (b), GSE116174 (c) and ICGC-LICA-FR (d) databases.
Fig. 6
Fig. 6
Low BHMT Expression Induces an Immunosuppressive Tumor Microenvironment. Through CIBERSORT deconvolution of TCGA-LIHC expression profiles, the infiltration levels of immune cells in each sample were quantified. (a) shows the infiltration levels of different cells in groups with high versus low BHMT expression, with white dots indicating median cell infiltration levels. Scatter plots reveal a positive correlation between M1 macrophage infiltration levels and BHMT expression (b). Correlation of BHMT expression at the pan-cancer level with cytokine (c) and cytokine receptor (d) expression. Expression of immune checkpoints in high versus low BHMT expression groups (e). HCC immunotherapy dataset GSE202069 was divided into high and low-BHMT groups based on the median BHMT expression, with Panel F demonstrating significant correlation between immunotherapy outcomes (response and non-response) and BHMT expression (f). *p value < 0.05, **p value < 0.01, ***p value < 0.001.
Fig. 7
Fig. 7
Analysis of Potential Mechanisms by Which BHMT Affects Tumor Prognosis. Utilizing BHMT associated genes, GO (a) and KEGG (b) enrichment analyses were conducted using BHMT-associated genes. In panel A, GO enrichment includes three categories: Biological Process (BP), Cellular Component (CC), and Molecular Function (MF). Furthermore, association analysis between BHMT and EHHADH (c), as well as ACSL1 (d) were applied. Based on tissue microarray of paraffin-embedded samples from 96 clinical HCC patients, immunohistochemistry about EHHADH (e) and ACSL1 (f) was performed to investigate their expression in BHMT positive and negative HCC tissues. The scale bar represents 100 μm.

Similar articles

References

    1. Torimura, T. & Iwamoto, H. Treatment and the prognosis of hepatocellular carcinoma in Asia. Liver Int.42, 2042–2054. 10.1111/liv.15130 (2022). - PubMed
    1. Bray, F. et al. Global cancer statistics 2022: GLOBOCAN estimates of incidence and mortality worldwide for 36 cancers in 185 countries. CA Cancer J. Clin.74, 229–263. 10.3322/caac.21834 (2024). - PubMed
    1. Huang, D. Q., Mathurin, P., Cortez-Pinto, H. & Loomba, R. Global epidemiology of alcohol-associated cirrhosis and HCC: trends, projections and risk factors. Nat. Rev. Gastroenterol. Hepatol.20, 37–49. 10.1038/s41575-022-00688-6 (2023). - PMC - PubMed
    1. Yang, J. D. & Heimbach, J. K. New advances in the diagnosis and management of hepatocellular carcinoma. BMJ371, m3544. 10.1136/bmj.m3544 (2020). - PubMed
    1. Jiang, Y. et al. Proteomics identifies new therapeutic targets of early-stage hepatocellular carcinoma. Nature567, 257–261. 10.1038/s41586-019-0987-8 (2019). - PubMed

MeSH terms