

Machine learning predicts spinal cord stimulation surgery outcomes and reveals novel neural markers for chronic pain
- PMID: 40102462
- PMCID: PMC11920397
- DOI: 10.1038/s41598-025-92111-8
Machine learning predicts spinal cord stimulation surgery outcomes and reveals novel neural markers for chronic pain
Abstract
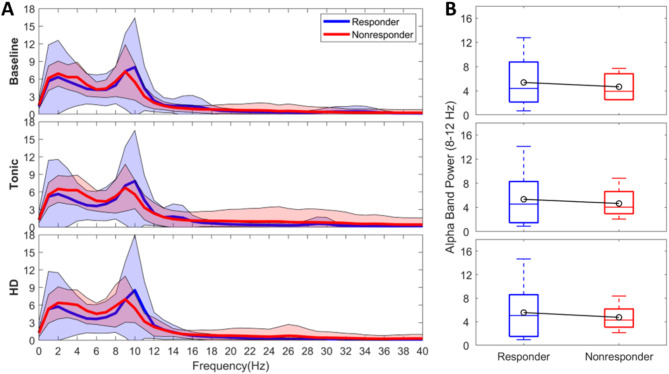
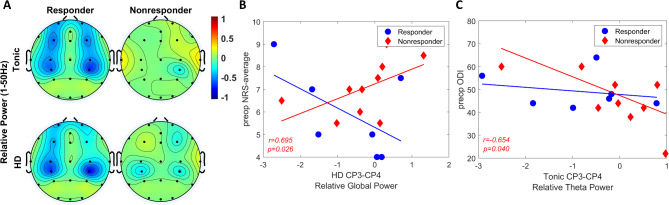
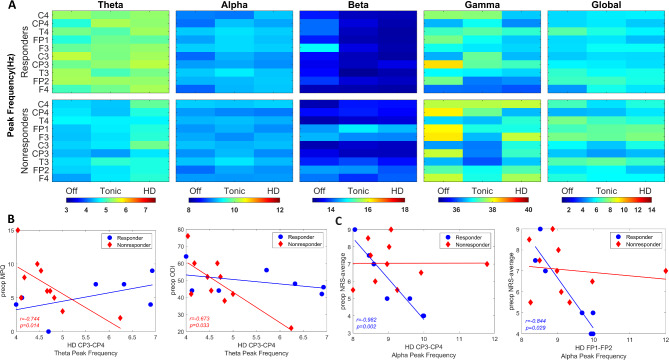
Spinal cord stimulation (SCS) is a well-accepted therapy for refractory chronic pain. However, predicting responders remain a challenge due to a lack of objective pain biomarkers. The present study applies machine learning to predict which patients will respond to SCS based on intraoperative electroencephalogram (EEG) data and recognized outcome measures. The study included 20 chronic pain patients who were undergoing SCS surgery. During intraoperative monitoring, EEG signals were recorded under SCS OFF (baseline) and ON conditions, including tonic and high density (HD) stimulation. Once spectral EEG features were extracted during offline analysis, principal component analysis (PCA) and a recursive feature elimination approach were used for feature selection. A subset of EEG features, clinical characteristics of the patients and preoperative patient reported outcome measures (PROMs) were used to build a predictive model. Responders and nonresponders were grouped based on 50% reduction in 3-month postoperative Numeric Rating Scale (NRS) scores. The two groups had no statistically significant differences with respect to demographics (including age, diagnosis, and pain location) or PROMs, except for the postoperative NRS (worst pain: p = 0.028; average pain: p < 0.001) and Oswestry Disability Index scores (ODI, p = 0.030). Alpha-theta peak power ratio differed significantly between CP3-CP4 and T3-T4 (p = 0.019), with the lowest activity in CP3-CP4 during tonic stimulation. The decision tree model performed best, achieving 88.2% accuracy, an F1 score of 0.857, and an area under the curve (AUC) of the receiver operating characteristic (ROC) of 0.879. Our findings suggest that combination of subjective self-reports, intraoperatively obtained EEGs, and well-designed machine learning algorithms might be potentially used to distinguish responders and nonresponders. Machine and deep learning hold enormous potential to predict patient responses to SCS therapy resulting in refined patient selection and improved patient outcomes.
Keywords: Chronic pain; EEG; Machine learning; Responders; Spinal cord stimulation.
© 2025. The Author(s).
Conflict of interest statement
Declarations. Competing interests: Dr. Pilitsis is the medical advisor for Aim Medical Robotics and has stock equity. Steven Paniccioli, Rachael Grey, Michael Briotte, and Kevin McCarthy are employees of Nuvasive Clinical Services. The remaining authors declare no competing interest.
Figures


Similar articles
-
Comparison of Two Modern Survival Prediction Tools, SORG-MLA and METSSS, in Patients With Symptomatic Long-bone Metastases Who Underwent Local Treatment With Surgery Followed by Radiotherapy and With Radiotherapy Alone.Clin Orthop Relat Res. 2024 Dec 1;482(12):2193-2208. doi: 10.1097/CORR.0000000000003185. Epub 2024 Jul 23. Clin Orthop Relat Res. 2024. PMID: 39051924
-
Comparison of clinical outcomes associated with spinal cord stimulation (SCS) or conventional medical management (CMM) for chronic pain: a systematic review and meta-analysis.Eur Spine J. 2023 Jun;32(6):2029-2041. doi: 10.1007/s00586-023-07716-2. Epub 2023 Apr 17. Eur Spine J. 2023. PMID: 37067600
-
Does the Presence of Missing Data Affect the Performance of the SORG Machine-learning Algorithm for Patients With Spinal Metastasis? Development of an Internet Application Algorithm.Clin Orthop Relat Res. 2024 Jan 1;482(1):143-157. doi: 10.1097/CORR.0000000000002706. Epub 2023 Jun 12. Clin Orthop Relat Res. 2024. PMID: 37306629 Free PMC article.
-
Effect of Neurostimulation on Chronic Pancreatic Pain: A Systematic Review.Neuromodulation. 2024 Dec;27(8):1255-1265. doi: 10.1016/j.neurom.2024.08.003. Epub 2024 Oct 4. Neuromodulation. 2024. PMID: 39365205
-
Spinal Cord Stimulation with Implantation of Surgical Leads is a Sufficient Salvage Therapy for Patients Suffering from Persistent Spinal Pain Syndrome-A Retrospective Single-center Experience.World Neurosurg. 2024 Dec;192:e474-e479. doi: 10.1016/j.wneu.2024.09.140. Epub 2024 Oct 29. World Neurosurg. 2024. PMID: 39395741
References
-
- Gee, L. et al. Spinal cord stimulation for the treatment of chronic pain reduces opioid use and results in superior clinical outcomes when used without opioids. Neurosurgery84, 217–226. 10.1093/neuros/nyy065 (2019). - PubMed
-
- Nunez, P. L. & Srinivasan, R. Electric Fields of the Brain: the Neurophysics of EEG (Oxford University Press, 2006).
MeSH terms
Substances
Grants and funding
LinkOut - more resources
Full Text Sources
Medical
Miscellaneous
