. 2025 Mar 19;15(1):9394.
doi: 10.1038/s41598-025-93060-y.

Integrated workflow for analysis of immune enriched spatial proteomic data with IMmuneCite

Affiliations

Integrated workflow for analysis of immune enriched spatial proteomic data with IMmuneCite

Arianna Barbetta et al. Sci Rep. .

Abstract

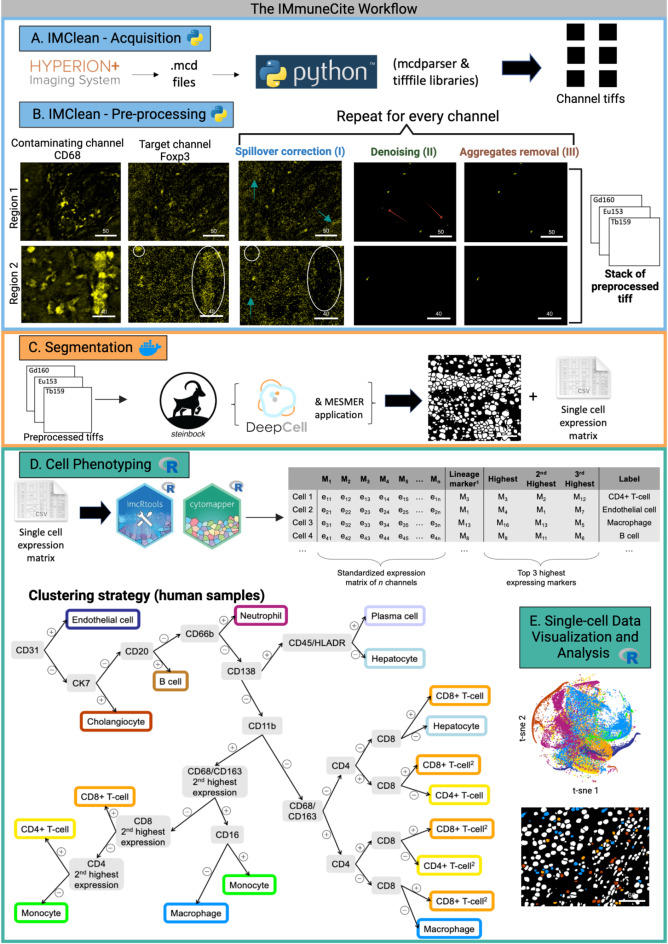
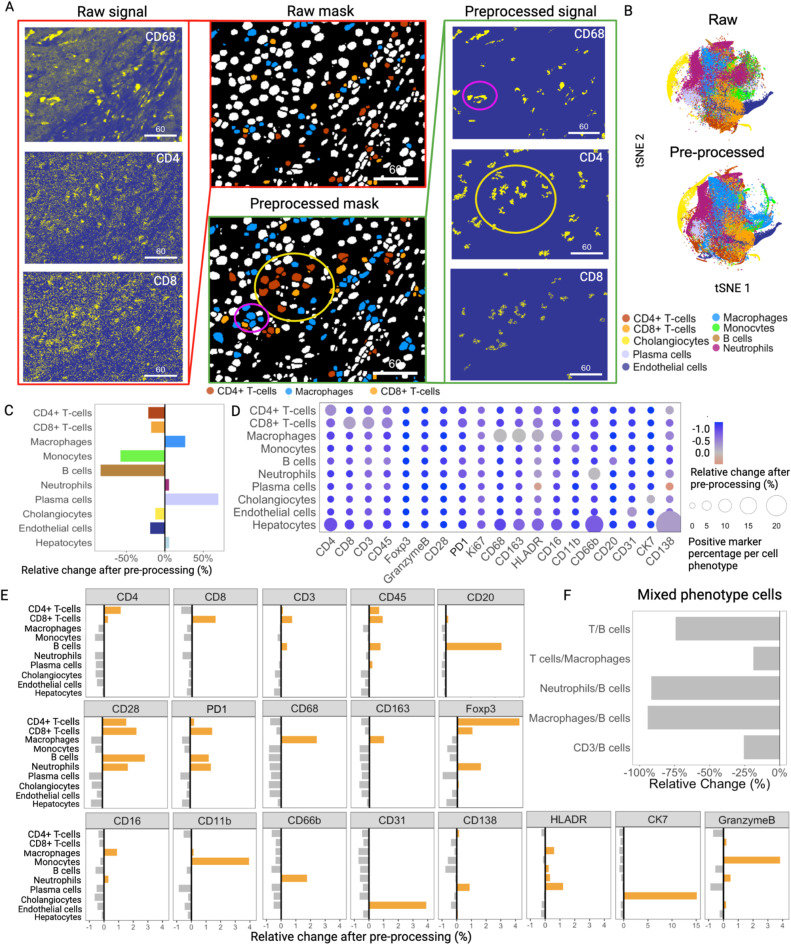
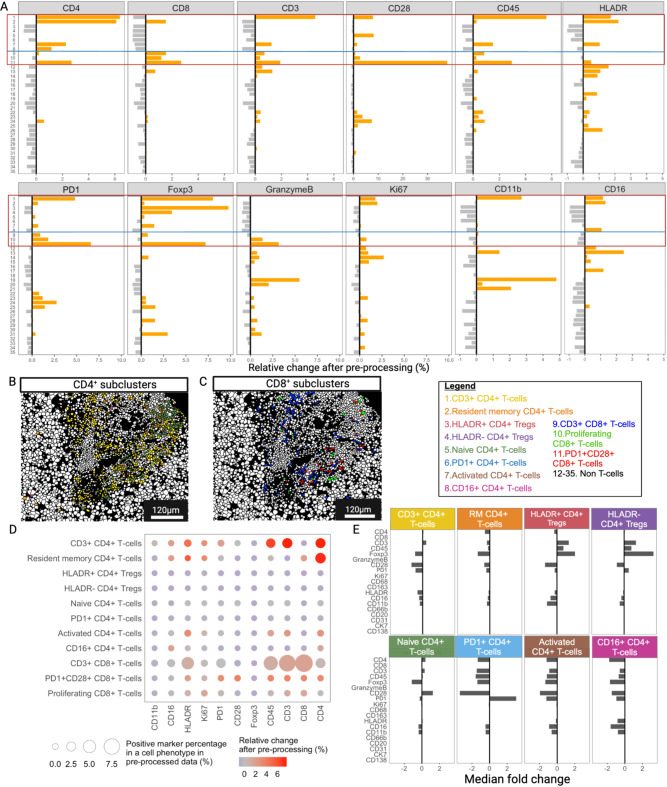
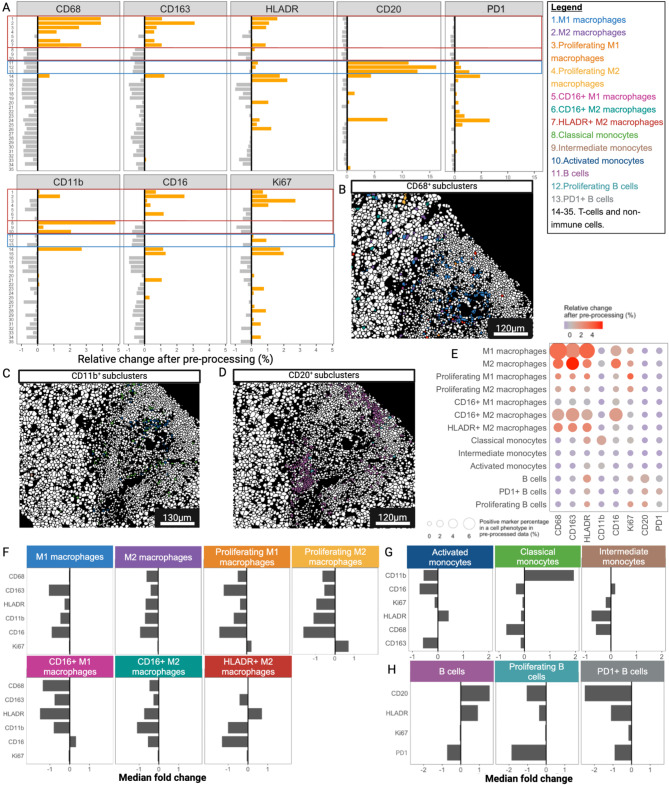
Spatial proteomics enable detailed analysis of tissue at single cell resolution. However, creating reliable segmentation masks and assigning accurate cell phenotypes to discrete cellular phenotypes can be challenging. We introduce IMmuneCite, a computational framework for comprehensive image pre-processing and single-cell dataset creation, focused on defining complex immune landscapes when using spatial proteomics platforms. We demonstrate that IMmuneCite facilitates the identification of 32 discrete immune cell phenotypes using data from human liver samples while substantially reducing nonbiological cell clusters arising from co-localization of markers for different cell lineages. We established its versatility and ability to accommodate any antibody panel and different species by applying IMmuneCite to data from murine liver tissue. This approach enabled deep characterization of different functional states in each immune compartment, uncovering key features of the immune microenvironment in clinical liver transplantation and murine hepatocellular carcinoma. In conclusion, we demonstrated that IMmuneCite is a user-friendly, integrated computational platform that facilitates investigation of the immune microenvironment across species, while ensuring the creation of an immune focused, spatially resolved single-cell proteomic dataset to provide high fidelity, biologically relevant analyses.

Keywords: Immune microenvironment; Informatics pipeline; Single cell proteomics; Spatial biology.


Conflict of interest statement

Competing interests: A provisional U.S. Patent of this pipeline has been filed by authors JE, SB, and AB (Processing Multiplexed Images and Analysis of Immune Enriched Spatial Proteomic Data. U.S. Patent serial number 63/562,886, filed March 8, 2024. Patent pending). All the remaining authors declare no conflict of interest.

Figures

Fig. 1
Fig. 1
Overview of the IMmuneCite workflow for spatial proteomic data consisting of pre-processing (IMClean, blue), segmentation (orange), and cell phenotyping (green). (A) Raw data (IMC mcd files) are imported into the IMClean pipeline and converted into .tiff files (a single .tiff file corresponds to a single channel). (B) Each single channel image is processed in a three-step approach: channel spillover correction (or channel crosstalk removal), denoising, and aggregate removal. For example: in region 2, the raw image shows two areas of channel spillover (white ovals), which are corrected for in the first processing step (background removal). The green arrows point at areas of unspecific signal (noise) corrected for in the second imaging processing step (denoising). Red arrows (region 1 image) highlight antibody aggregates that are removed during the final step (aggregates removal). Afterwards, a stack of tiffs is created for each tissue section (also known as ROI) to include each channel to be used for analysis and is ready for image segmentation. (C) IMClean-processed images are segmented using Mesmer to obtain single-cell masks and expression matrix to use for downstream analysis. (D) Marker expression measurements are read into R and used for cell phenotype assignment using our IMmuneCite clustering algorithm for human samples. Information on the top three highest expressed markers is extracted and used for cell categorization and metaclusters phenotype assignment based on the algorithmic tree schematized in D. (1Needs to have a positive value; 2To account for imperfect CD4 staining (cells co-expressing CD4 and CD8) and spillover of signal from macrophages (due to their shape) into adjacent cell masks (cells co-expressing CD68/CD163 and CD4/CD8) (E) Finally, single-cell data can be statistically compared, and cell phenotype can be visualized onto the mask of the corresponding tissue section (Scale bar unit = μm).
Fig. 2
Fig. 2
The IMmuneCite workflow facilitates and improves phenotyping of immune cells within immune enriched human liver tissue. (A) Example of representative CR liver tissue section showing raw signal and IMClean-processed signal; IMClean enhances the identification of CD4+ T-cells, CD8+ T-cells, and macrophages compared to the same raw signal image as shown in the corresponding cell masks (Scale bar unit = μm). (B) t-SNE plots showing differences in metacluster density and distribution in raw vs IMClean-processed TCMR data. (C) Relative change in cell percentage within each metacluster before and after image pre-processing; IMClean increased the number of macrophages, plasma cells, neutrophils, and hepatocytes identified in the human liver rejection IMC dataset. (D) IMClean reduces non-specific marker signal while enhancing the specific ones within the appropriate cell types. The circle size indicates the positive marker percentage in a particular phenotype, and the circle color indicates the relative change of the positive rate for a particular marker after pre-processing. (E) IMClean pre-processing increases the specificity of the immune metacluster phenotyping; in relation to each marker, the ratios of specific metaclusters expressing a certain marker increase while the ratios of non-specific phenotypes for a particular marker decrease, thus showing a biologically appropriate correlation between markers and assigned metacluster. The relative change is defined as the difference in percentage composition of each cell type between IMClean-processed and raw data. (F) IMClean reduces the frequency of cells showing mixed phenotypes—cells that express markers belonging to different cell lineages (e.g. CD20 and CD8, or CD68 and CD4)—thus decreasing the rate of non-biological immune phenotypes.
Fig. 3
Fig. 3
The IMmuneCite workflow enhances T lymphocyte subcluster identification and provides details on cell activation states. (A) IMClean pre-processing increases the specificity of the immune subcluster phenotyping; for each marker, the ratio of each specific subcluster increases while those of non-specific phenotypes decrease, making cell phenotype and expressed markers biologically appropriate. For example: after IMClean pre-processing, ratio of cells with a positive PD1 expression was increased in CD4+ and CD8+ T-cell subclusters while a negative (decrease) ratio of PD1 positive cells was observed in non-T and B-cell subclusters (Subclusters 12–35 = 12: M1 macrophages; 13: M2 macrophages; 14: Proliferating M1 macrophages, 15: Proliferating M2 macrophages; 16: CD16+ M1 macrophages; 17: CD16+ M2 macrophages; 18: HLADR+ M2 macrophages; 19: Classical monocytes; 20: Intermediate monocytes; 21: Activated monocytes; 22: B cells; 23: Proliferating B cells; 24: PD1+ B cells; 25: Neutrophils; 26: Plasma cells; 27: Cholangiocytes; 28: Proliferating Cholangiocytes; 29: HLADR+ Cholangiocytes; 30: Endothelial cells; 31: Proliferating Endothelial cells; 32: HLADR+ Endothelial cells, 33: Hepatocytes; 34: Proliferating Hepatocytes; 35: HLADR+ Hepatocytes). (B) Representative zoomed-in liver tissue section highlighting CD4+ T-cells colored by cell subpopulation (see color key legend). Among the subpopulations identified via unsupervised clustering within the CD4+ T-cell metacluster in both the raw and preprocessed datasets, eight emerged to be common to both datasets: Resident Memory CD4+ T-cells, CD3+CD4+ T-cells, Activated (HLADRhi) CD4+ T-cells, CD16+CD4+ T-cells, Naïve CD4+ T-cells, HLADR+CD4+ Tregs, HLADR-CD4+ Tregs, and PD1+CD4+ T-cells. (C) Representative zoomed-in liver tissue section highlighting the CD8+ compartment (see color key legend); after using unsupervised clustering algorithm, three CD8+ T-cell subclusters were identified to have the same expression patterns in both the raw and the IMClean-processed datasets (CD3+CD8+ T-cells, Proliferating (Ki67+) T-cells, and PD1+CD28+ T-cells) for which marker expressions were compared before and after IMClean pre-processing (as show in A). (D) Comparison of marker expression between raw and IMClean-processed T-cell subclusters showed that IMClean reduces non-specific marker signal while enhancing the specific ones within cell types. The circle size indicates the positive marker percentage in a particular phenotype, and the circle color indicates the relative change of the positive rate for a particular marker after pre-processing. (E) Median fold change of marker expression between raw and IMClean-processed for CD4+ T-cell subclusters.
Fig. 4
Fig. 4
The IMmuneCite workflow enables an accurate phenotyping and depiction of cellular states of Monocyte, Macrophage, and B cell subclusters. (A) IMClean pre-processing increases the specificity of subcluster phenotyping within the monocyte, macrophage, and B cell compartments; given a certain positive marker, the ratio of each specific subcluster (for that marker) increases while that of non-specific phenotypes decreases, making cell phenotype and expressed markers biologically appropriate. For example: after IMClean pre-processing, ratio of cells with a positive CD68 expression was increased only in macrophage subclusters while a negative (decrease) ratio of CD68 positive cells was observed in T and B-cell subclusters (Subclusters 14–35 = 14: CD3+ CD4+ T-cells; 15: Resident memory CD4+ T-cells; 16: HLADR+ CD4+ Tregs; 17: HLADR- CD4+ Tregs; 18: Naïve CD4+ T-cells; 19: PD1+ CD4+ T-cells; 20: Activated CD4+ T-cells; 21: CD16+ CD4 + T-cells; 22: CD3+ CD8+ T-cells; 23: Proliferating CD8+ T-cells; 24: PD1+ CD28+ CD8+ T-cells; 25: Neutrophils; 26: Plasma cells; B cells; 23: Proliferating B cells; 24: PD1+ B cells; 25: Neutrophils; 26: Plasma cells; 27: Cholangiocytes; 28: Proliferating Cholangiocytes; 29: HLADR+ Cholangiocytes; 30: Endothelial cells; 31: Proliferating Endothelial cells; 32: HLADR+ Endothelial cells, 33: Hepatocytes; 34: Proliferating Hepatocytes; 35: HLADR+ Hepatocytes). (B) Representative zoomed-in liver tissue section highlighting macrophages colored by cell subpopulation (see color key legend). Subpopulations were identified via unsupervised clustering within the macrophage metacluster in both raw and pre-processed datasets. Seven distinct subpopulations emerged to be common between the two datasets: M1 and M2 populations, Proliferating (Ki67+) M1 macrophages, Proliferating (Ki67+) M2 macrophages, CD16+ M1 macrophages, CD16+ M2 macrophages, and HLADR+ M2 macrophages. (C) Representative zoomed-in liver tissue section highlighting monocyte subpopulations (see color key legend); after unsupervised clustering applied to both datasets, three subpopulations were identified to have the same expression patterns in both the raw and the IMClean-processed datasets: Classical monocytes (CD11b+), Intermediate (CD16+CD68+CD163+) monocytes and Activated (HLADRhigh) monocytes. (D) Representative zoomed-in liver tissue section showing B-cell subclusters identified via unsupervised clustering in both raw and IMClean-processed datasets, which shared the following B-cell subpopulations: B cells (CD45+CD20+HLADR+), PD1+ B cells (CD45+CD20+HLADR+PD1+), and proliferating B cells (CD45+CD20+HLADR+Ki67+). (E) Comparison of marker expressions between raw and IMClean-processed for monocyte, macrophage, and B cell subclusters showed that IMClean reduces non-specific marker signal while enhancing the specific ones within cell types. The circle size indicates the positive marker percentage in a particular phenotype, and the circle color indicates the relative change of the positive rate for a particular marker after pre-processing. (F–H) Median fold change of marker expression between raw and IMClean-processed for macrophage, monocyte, and B cell subclusters, respectively.
Fig. 5
Fig. 5
IMmuneCite clustering algorithm used to analyze IMC data obtained from HCC mouse model. The IMmuneCite clustering pipeline is robust across multiple disease’ immune microenvironments and species. We adapted our IMmuneCite clustering algorithm to analyze IMC data obtained from four different HCC mouse models. After IMClean pre-processing and segmentation of images, marker expression measurements contained in the single-cell expression matrix are read into R and used for cell phenotype assignment using the IMmuneCite clustering algorithm adapted for mouse samples. Information on the top three highest expressed markers is extracted and used for cell categorization and phenotype assignment based on the algorithmic tree schematized above. The top five highest expressed markers were used for macrophages identification. 1To account for broad and unspecific expression of CD29 and spillover of signal from macrophages (due to their shape) into adjacent cell masks (cells co-expressing CD11c or CD68/CD4 and CD68/B220).
Fig. 6
Fig. 6
Validation of the IMmuneCite workflow in IMC data from murine HCC tissue demonstrates an enhancement in the quality of data in structurally complex immune enriched tissues. (A) Heatmaps showing scaled marker expression within the 10 metaclusters identified in both raw and IMClean-processed external IMC mouse data, with grey bars indicating the total number of cells per cell type. (B) t-SNE plots comparing raw and pre-processed data showing different density and distribution of cell metaclusters in raw vs IMClean-processed data. (C) Relative change in cell percentage within each metacluster before and after image pre-processing; IMClean increased the number of macrophages, myofibroblasts, dendritic cells, and epithelial cells identified after image pre-processing. (D) Within each metacluster, IMClean reduces non-specific marker signal while enhancing the specific ones for a particular cell phenotype. The circle size indicates the positive marker percentage in a particular phenotype, and the circle color indicates the relative change of the positive rate for a particular marker after pre-processing. (E) IMClean pre-processing increases the specificity of the metacluster phenotyping; in relation to each marker, the ratios of specific metaclusters expressing a certain marker increase while the ratios of non-specific phenotypes for a particular marker decrease, thus showing a biologically appropriate correlation between markers and assigned metacluster. Relative percentage change was computed as positive cell (%) in the IMClean-processed data minus positive cell (%) in raw data divided by the total number of cells in the raw data. (F) Representative tissue section showing the spatial location of the ten identified metaclusters, which highlights structural components and infiltrating immune cells within mouse HCC tissue (Scale bar unit = μm).
Fig. 7
Fig. 7
The IMmuneCite workflow allows discrete phenotyping of T and B-cell compartments in murine HCC tissue. (A) Assessment of IMC data from HCC mouse models showed that the IMmuneCite workflow increases the specificity of CD4+ and CD8+ T-cell subcluster phenotyping; for each marker, the ratio of specific subclusters with positive expression increases while the ratio of non-marker specific phenotypes decreases. (B) Comparison of marker expression between raw and IMClean-processed for CD4+ and CD8+ T-cells showed that pre-processing reduces the non-specific marker signal while the specific ones are enriched in their respective cell types. The circle size indicates the positive marker percentage in a particular phenotype, and the circle color indicates the relative change of the positive rate for a particular marker after pre-processing. (C) Representative zoomed-in of mouse HCC liver tissue section highlighting CD4+ T-cells colored by cell subpopulation (see color key legend). Subpopulations identified via unsupervised clustering within the CD4+ T-cell metacluster in both the raw and processed datasets are CD3+ CD4+ T-cells, PD1+ (PD1+ CD3+) CD4 + T-cells, CD4+ (CD161+ Granzyme B+ CD3+) NKT cell, and CD4+ (CD3+ FoxP3+) Tregs. (D) Representative zoomed-in mouse HCC liver tissue section highlighting CD8+ T-cell compartment (see color key legend); after using unsupervised clustering algorithm, four CD8+ T-cell subclusters were identified to have the same expression patterns in both the raw and the IMClean-processed datasets: CD3+CD8+ T-cells, Proliferating (Ki67+) T-cells, and PD1+ (CD3+) CD8+ T-cells, and Cytotoxic (Granzyme B+ CD3+ CD8+) T-cell. (E) In the B cell compartment, IMClean increases the specificity of subcluster phenotyping; the ratio of specific subclusters with positive scaled expression for a certain marker increases while the ratio of non-specific subclusters decreases. (F) Comparison of marker expressions between raw and IMClean-processed in B cell subclusters showed that IMClean reduces non-specific marker signal while enhancing the specific ones within cell types. The circle size indicates the positive marker percentage in a particular phenotype, and the circle color indicates the relative change of the positive rate for a particular marker after pre-processing. (G) Representative case showing spatial distribution of B cell subclusters within mouse HCC tissue section including generic B cells (CD45+ B220+), Proliferating (Ki67+ CD45+) B cells, and PDL1+ (CD45+) B cells.
Fig. 8
Fig. 8
The IMmuneCite workflow enables an accurate phenotyping of macrophages and dendritic cells in mouse HCC tissue. (A, B) The IMmuneCite workflow ameliorates both specificity (A) and sensitivity (B) of macrophage sub-phenotyping; for a certain marker with a positive scaled expression, the ratios of specific subclusters increase while the ratios of non-specific subclusters decrease, as shown in (A). For each macrophage subcluster, processing reduces the non-specific marker signal while the specific ones are enriched (B). The circle size indicates the positive marker percentage in a particular phenotype, and the circle color indicates the relative change of the positive rate for a particular marker after IMClean pre-processing. (C, D) IMClean increases the specificity (C) and sensitivity (D) of dendritic cell subcluster phenotyping; the ratios of specific subclusters with positive scaled expression for a certain marker increase (C). Comparison of marker expressions between raw and IMClean-processed for dendritic cell subclusters showed that IMClean enhances the specific marker signal within cell types (D). The circle size indicates the positive marker percentage in a particular phenotype, and the circle color indicates the relative change of the positive rate for a particular marker after pre-processing. (E) Representative zoomed-in mouse HCC liver tissue section highlighting macrophages colored by cell subpopulation (see color key legend). Subpopulations commonly identified via unsupervised clustering within macrophage compartments in both the raw and processed datasets are M1 macrophages (CD45+ F480+ CD68+), M2 macrophages (CD206+ CD68+ F480+), Proliferating PDL1+ macrophages (CD45+ PDL1+ MHCII+ CD68+ F480+) and CD86+ M1 (CD45+ MHCII+ CD68+ F480+) macrophages, S100A9+ M1 (CD45+ CD68+ F480+) macrophages, and S100A9 (CD206+ F480+) M2 macrophages. (F) Representative case showing spatial distribution of dendritic cell subclusters commonly identified in both datasets in mouse HCC tissue section including Dendritic cells (CD11c+) and PDL1+ (CD45+ CD86+ MHCII+ CD11c+) Dendritic cells (see color key legend).

Update of

Similar articles

Cited by

References

    1. Barbetta, A., Rocque, B., Sarode, D., Bartlett, J. A. & Emamaullee, J. Revisiting transplant immunology through the lens of single-cell technologies. Semin. Immunopathol.45(1), 91–109. 10.1007/S00281-022-00958-0 (2022). - PMC - PubMed
    1. Sorin, M. et al. Single-cell spatial landscapes of the lung tumour immune microenvironment. Nature614(7948), 548–554. 10.1038/s41586-022-05672-3 (2023). - PMC - PubMed
    1. Danenberg, E. et al. Breast tumor microenvironment structures are associated with genomic features and clinical outcome. Nat. Genet.54(5), 660–669. 10.1038/s41588-022-01041-y (2022). - PMC - PubMed
    1. Kondo, A. et al. Highly multiplexed image analysis of intestinal tissue sections in patients with inflammatory bowel disease. Gastroenterology161(6), 1940–1952. 10.1053/j.gastro.2021.08.055 (2021). - PMC - PubMed
    1. Ramaglia, V. et al. Multiplexed imaging of immune cells in staged multiple sclerosis lesions by mass cytometry. eLife8, e48051. 10.7554/eLife.48051 (2019). - PMC - PubMed

LinkOut - more resources