. 2025 Mar 18;16(1):2666.
doi: 10.1038/s41467-025-57947-8.

Complement-mediated enhancement of SARS-CoV-2 antibody neutralisation potency in vaccinated individuals

Collaborators, Affiliations

Complement-mediated enhancement of SARS-CoV-2 antibody neutralisation potency in vaccinated individuals

Jack Mellors et al. Nat Commun. .

Abstract

With the continued emergence of SARS-CoV-2 variants and concerns of waning immunity, there is a need for better defined correlates of protection to aid future vaccine and therapeutic developments. Whilst neutralising antibody titres are associated with protection, these are typically determined in the absence of the complement system, which has the potential to enhance neutralisation titres and strengthen correlates with protection in vivo. Here we show that replenishment of the complement system in neutralisation assays can significantly enhance neutralisation titres, with up to an ~83-fold increase in neutralisation of the BA.1.1.529 strain using cross-reactive sera from vaccination against the ancestral strain. The magnitude of enhancement significantly varies between individuals, viral strains (wild-type/VIC01 and Omicron/BA.1), and cell lines (Vero E6 and Calu-3), and is abrogated following heat-inactivation of the complement source. Utilising ACE2 competition assays, we show that the mechanism of action is partially mediated by reducing ACE2-spike interactions. Through the addition of compstatin (a C3 inhibitor) to live virus neutralisation assays, the complement protein C3 is shown to be required for maximum efficiency. These findings further our understanding of SARS-CoV-2 immunity and neutralisation, with implications for protection against emerging variants and assessing future vaccine and therapeutic developments.


Conflict of interest statement

Competing interests: The authors declare no competing interests.

Figures
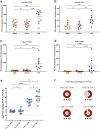
Fig. 1
Fig. 1. The presence of the complement system significantly increased SARS-CoV-2 neutralisation titres in the OPTIC vaccinee cohort.
50% neutralisation titres (NT50) were determined via microneutralisation assays for all OPTIC vaccinee serum samples following the addition of media-only (DMEM/MEM), heat-inactivated (HI)-FCS, or pooled human plasma (PHP). a Vero E6 cells infected with VIC01 (n = 10) (PHP vs. DMEM, p = 0.0002; PHP vs. HI-FCS, p = 0.0002); b Vero E6 cells infected with BA.1 (n = 8) (PHP vs. DMEM, p = 0.0070; PHP vs. HI-FCS, p = 0.0063); c Calu-3 cells infected with VIC01 (n = 10) (PHP vs. MEM, p = 0.0050; PHP vs. HI-FCS, p = 0.0043); d Calu-3 cells infected with BA.1 (n = 9) (PHP vs. DMEM, p = <0.0001; PHP vs. HI-FCS, p = <0.0001). Each spot shows the average NT50 value for each sample determined by a 4-parameter logistic curve from four replicates across duplicate assays. Error bars show the mean with the standard error. Significance was determined using a one-way ANOVA with Geisser-Greenhouse correction and Tukey’s multiple comparisons test. e Log2 fold-changes in NT50 between HI-FCS and PHP represents the enhancement of neutralisation via the complement system for each condition shown in (ad) (Vero E6/BA.1 vs. Calu-3/BA.1, p = 0.0015; Calu-3/VIC01 Vs Calu-3/BA.1, p = 0.0210; Calu-3/VIC01 Vs. Vero E6/VIC01, p = <0.0001). Statistical significance was determined using a one-way ANOVA mixed effects analysis with Geisser-Greenhouse correction and Šídák’s multiple comparisons test. Error bars show the mean value with standard deviation. For (ae), arbitrary values of 10 were used for samples with a predicted NT50 below this value. If an NT50 value could not be determined in any condition, then the sample was omitted. f Significant differences in NT50 were determined for each individual using the sum-of-squares F-test with non-overlapping 95% confidence intervals. The outside number shows the total sample size and the centre number (shown as a percentage in red) reports the number of individuals with a significant increase in NT50 following the addition of PHP. All results were analysed and presented using GraphPad Prism (Version 10) and Inkscape. *p < 0.05, **p < 0.01, ***p < 0.001, ****p < 0.0001. Source data are provided as a Source Data file.
Fig. 2
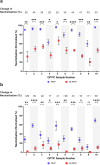
Fig. 2. The enhancement of SARS-CoV-2 neutralisation titres in the presence of the complement system was heat labile.
Comparison of SARS-CoV-2 (VIC01) neutralisation using 20% pooled human plasma (PHP) or 20% heat-inactivated (HI)-PHP for all vaccinee serum samples in the OPTIC cohort (n = 10) at a a 1:1500 and b 1:4500 dilution. Each dot is the average of six replicates across duplicate assays and the error bars show the standard error. All samples showed a significant decrease in SARS-CoV-2 neutralisation following the heat inactivation of PHP (paired, two-sided T-test, p < 0.05), excluding one sample with values close to the limit of detection. The results were analysed and presented using GraphPad Prism (Version 10). *p < 0.05, **p < 0.01, ***p < 0.001, ****p < 0.0001. Exact p values for a 1 (p = 0.0021), 2 (p = 0.0002), 3 (p = 0.0003), 4 (p = 0.0305), 5 (p = 0.0113), 6 (p = 0.0024), 7 (p = 0.0001), 8 (p = 0.0007), 9 (p = 0.0020), 10 (p = 0.0002) and b 1 (p = 0.0034), 2 (p = <0.0001), 3 (p = 0.0083), 4 (p = 0.0376), 5 (p = 0.0002), 6 (p = 0.0070), 7 (p = 0.0005), 8 (p = 0.0236), 9 (p = 0.0725), 10 (p = 0.0001). Source data are provided as a Source Data file.
Fig. 3
Fig. 3. A complement-mediated mechanism of enhancement for SARS-CoV-2 neutralisation titres.
Use of transmission electron microscopy (TEM), compstatin, and ACE2 inhibition assays to determine the mechanism of complement-enhanced neutralisation. a TEM was used to identify possible viral aggregation and/or lysis following incubation with immune sera (using representative data from OPTIC sample 8) and pooled human plasma (PHP) or heat-inactivated (HI)-PHP. Each biological sample was tested in duplicate with a total of 136 images captured across three magnifications. No clear difference was observed between the conditions tested. The black arrows indicate examples of the SARS-CoV-2 (VIC01) particles. b Microneutralisation assays with compstatin or a control peptide showed the effects of C3 inhibition. Each spot represents the mean value of 6 replicates across duplicate assays and error bars show the standard error. The addition of PHP with either compstatin or the control peptide significantly increased SARS-CoV-2 neutralisation. A further increase in neutralisation was observed with the use of the control peptide, which was significant in 2/3 samples using a two-way ANOVA with Tukey’s multiple comparisons test. Exact p values for samples 2 (media vs. control, p = <0.0001; media vs. compstatin, p = 0.0015; compstatin vs. control, p = 0.0032), 8 (media vs. control, p = <0.0001; media vs. compstatin, p = <0.0001; compstatin vs. control, p = 0.2562), and 10 (media vs. control, p = <0.0001; media vs. compstatin, p = <0.0001; compstatin vs. control, p = 0.0012) c Human ACE2 competition assays were supplemented with either PHP or HI-PHP to measure the effect of complement on ACE2 binding to various SARS-CoV-2 spike proteins. The presence of complement significantly enhanced ACE2 inhibition for all antigens tested. Each spot represents duplicate values of 4 OPTIC serum samples and the error bars show the standard error. Sample dilutions of either 1:10 or 1:100 are shown dependent on whether the observations were within the limits of detection. Significance was determined using paired, two-sided T-tests for each antigen. Exact p values are 0.0004 (BA.2.12.1), <0.0001 (BA.2.75), 0.0001 (BA.2-1…), 0.0041 (B.1.1.529), 0.0256 (Wuhan), 0.0302 (B.1.617.2;AY.4), 0.0035 (B.1.1.7), 0.0085 (B.1.351), 0.0334 (BA.5). The results were analysed and presented using GraphPad Prism (Version 10). *p < 0.05, **p < 0.01, ***p < 0.001, ****p < 0.0001. Antigen “BA.2-1…” includes: BA.2; BA.2.1; BA.2.2; BA.2.3; BA.2.5; BA.2.6; BA.2.7; BA.2.8; BA.2.10; BA.2.12. Antigen “B.1.1.529” includes: B.1.1.529; BA.1; BA.1.15. Source data are provided as a Source Data file.
Fig. 4
Fig. 4. Comparison of 50% neutralisation titres (NT50s) against SARS-CoV-2 (VIC01) in the OCTAVE and OPTIC cohorts.
a NT50s were determined via microneutralisation assays (MNAs) for all OCTAVE vaccinee serum samples (n = 21) supplemented with either heat-inactivated FCS (HI-FCS) or pooled human plasma (PHP). Each dot represents the duplicate NT50 values of a single sample from the first series of experiments and significance between populations was determined using a two-tailed Wilcoxon matched-pairs test in GraphPad Prism (Version 10) (p = 0.0003). Error bars show the mean value with the standard error. Significance between HI-FCS and PHP for each individual was determined by the sum-of-squares F-test with non-overlapping 95% confidence intervals and only the significant samples were repeated across 3 independent experiments. The pie chart shows the number of these samples with a significant increase (central number represented in red) against the total population (outside number). b Log2 fold-change comparing the addition of PHP versus HI-FCS on NT50 values against SARS-CoV-2. Significance between Vero E6/VIC01 conditions for the NT50s of OCTAVE (n = 21) and OPTIC vaccinee serum samples (n = 10) were determined using a two-tailed Welch’s t-test in GraphPad Prism (Version 10) (p = <0.0001). Each spot shows the difference in NT50 values between the addition of PHP or HI-FCS for each sample, determined via a 4-parameter logistic curve using 7 (OCTAVE) sera dilution points as described for (a) or using 12 (OPTIC) sera dilution points with four replicates across duplicate assays (OPTIC). Error bars show the standard deviation. *p < 0.05, **p < 0.01, ***p < 0.001, ****p < 0.0001. Source data are provided as a Source Data file.
Fig. 5
Fig. 5. Comparison of antibody characteristics between samples with (Enhanced cohort) or without (Non-Enhanced cohort) evidence of complement-enhanced neutralisation.
a Total SARS-CoV-2 spike IgG titres measured via electrochemiluminescence (ECL) using Meso Scale Discovery assays (p = 0.0029). Each dot represents the average ECL signal of each background-subtracted sample tested in duplicate (b) Median fluorescence intensity (MFI) of SARS-CoV-2 spike-specific IgG1-4 in all samples determined via flow cytometry. Each dot represents the average MFI of each background-subtracted sample tested in duplicate. c Pairwise comparison of MFI of IgG1-4 SARS-CoV-2 spike-specific titres (IgG1, p = 0.0321; IgG2, p = 0.0098; IgG3, p = <0.0001; IgG4, p = 0.3216). Each dot represents MFI values as described for (b) Dotted lines show the mean MFI of negative samples plus 3 standard deviations. d Pairwise comparison of antibody-dependent complement deposition (ADCD) between the Enhanced and Non-Enhanced cohorts, using MFI to measure C3c deposition (p = 0.0031). Each dot represents the average MFI from each sample tested in duplicate and interpolated from a standard curve assigned with arbitrary ‘Complement Activating Units’. For (ad), statistical significance was determined using an unpaired, two-sided t-test and error bars show the mean value with standard deviation (SD), comparing the Enhanced (a, n = 14; bd, n = 13) and Non-Enhanced cohorts (n = 17). e Two-tailed Pearson correlation with Benjamini Hochberg false discovery rate of 0.05 to compare relationships of antibody characteristics within the two cohorts. f Mean decrease in gini, representing the order of variable importance for determining node purity in the random forest model to classify outcome of complement-enhanced neutralisation. g Ridge regression coefficients in order of positive relationship with complement-enhanced neutralisation. Dots represent the mean coefficient for each antibody characteristic, with 95% confidence intervals (CIs). Features with CIs not overlapping 0 were considered to be important predictors. f and g used data containing total SARS-CoV-2 spike-specific IgG titres, IgG subclass titres, ADCD, and antibody epitope specificity to Coronavirus antigens to determine complement-enhanced neutralisation. Statistical analysis for (ae) was determined using GraphPad Prism (Version 10). Modelling for (f and g) was performed in RStudio. *p < 0.05, **p < 0.01, ***p < 0.001, ****p < 0.0001. Receptor binding domain (RBD), spike protein (S), nucleocapsid (N), coronavirus (CoV). Source data are provided as a Source Data file.

References

    1. Sun, K. et al. SARS-CoV-2 correlates of protection from infection against variants of concern. Nat. Med.30, 2805–2812 (2024). - PMC - PubMed
    1. Burton, D. R. Antiviral neutralizing antibodies: from in vitro to in vivo activity. Nat. Rev. Immunol.23, 720–734 (2023). - PMC - PubMed
    1. Wilson, J. A. et al. Epitopes involved in antibody-mediated protection from Ebola virus. Science287, 1664–1666 (2000). - PubMed
    1. Feng, J. Q., Mozdzanowska, K. & Gerhard, W. Complement component C1q enhances the biological activity of influenza virus hemagglutinin-specific antibodies depending on their fine antigen specificity and heavy-chain isotype. J. Virol.76, 1369–1378 (2002). - PMC - PubMed
    1. Jayasekera, J. P., Moseman, E. A. & Carroll, M. C. Natural antibody and complement mediate neutralization of influenza virus in the absence of prior immunity. J. Virol.81, 3487–3494 (2007). - PMC - PubMed

MeSH terms

Supplementary concepts