

Altered auditory brainstem responses are post-acute sequela of SARS-CoV-2 (PASC)
- PMID: 40102496
- PMCID: PMC11920441
- DOI: 10.1038/s41598-025-93664-4
Altered auditory brainstem responses are post-acute sequela of SARS-CoV-2 (PASC)
Abstract
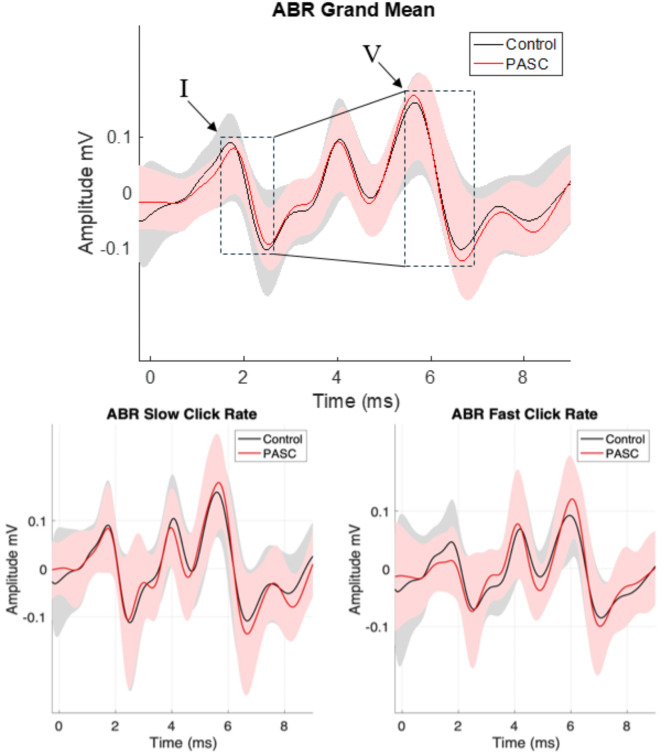
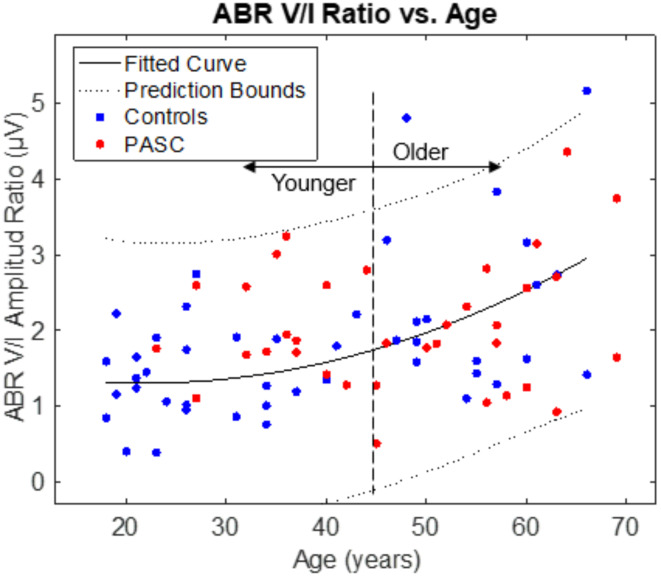
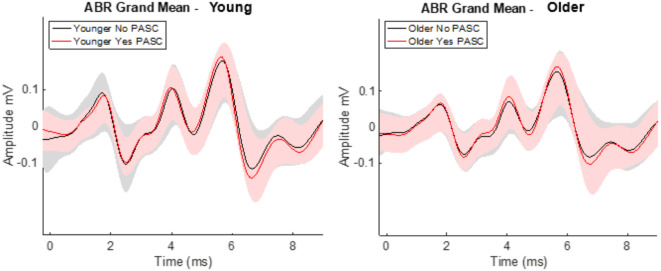
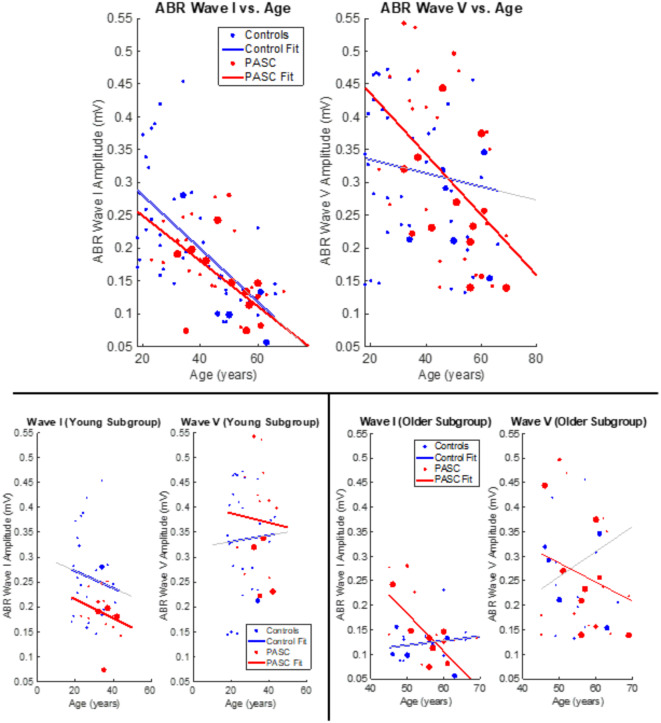
The Post-acute Sequela of SARS-CoV-2 (PASC) syndrome, also known as Long-COVID, often presents with subjective symptoms such as brain fog and cognitive fatigue. Increased tinnitus, and decreased hearing in noise ability also occur with PASC, yet whether auditory manifestations of PASC are linked with the cognitive symptoms is not known. Electrophysiology, specifically the Auditory Brainstem Response (ABR), provides objective measures of auditory processing. We hypothesized that ABR findings would be linked to PASC and with subjective feelings of cognitive fatigue. Eighty-two individuals, 37 with PASC (mean age: 47.5, Female: 83%) and 45 healthy controls (mean age: 38.5, Female: 76%), were studied with an auditory test battery that included audiometry and ABR measures. Peripheral hearing thresholds did not differ between groups. The PASC group had a higher prevalence of tinnitus, anxiety, depression, and hearing handicap in addition to increased subjective cognitive fatigue. ABR latency findings showed a significantly greater increase in the wave V latency for PASC subjects when a fast (61.1 clicks/sec) compared to a slow click (21.1 clicks/sec) was used. The increase in latency correlated with cognitive fatigue scores and predicted PASC status. The ABR V/I amplitude ratio was examined as a measure of central gain. Although these ratios were not significantly elevated in the full PASC group, to minimize the cofounding effect of age, the cohort was median split on age. Elevated V/I amplitude ratios were significant predictors of both predicted PASC group classification and cognitive fatigue scores in the younger PASC subjects compared to age-matched controls providing evidence of elevated central gain in younger individuals with PASC. More frequent tinnitus also significantly predicted higher subjective cognitive fatigue scores. Our findings suggest that PASC may alter the central auditory pathway and lead to slower conduction and elevated auditory neurophysiology responses at the midbrain, a pattern associated with the typical aging process. This study marks a significant stride toward establishing an objective measure of subjective cognitive fatigue through assessment of the central auditory system.
© 2025. The Author(s).
Conflict of interest statement
Declarations. Competing interests: The authors declare no competing interests.
Figures
Similar articles
-
Signs and symptoms to determine if a patient presenting in primary care or hospital outpatient settings has COVID-19.Cochrane Database Syst Rev. 2022 May 20;5(5):CD013665. doi: 10.1002/14651858.CD013665.pub3. Cochrane Database Syst Rev. 2022. PMID: 35593186 Free PMC article.
-
Chronic Electro-Acoustic Stimulation May Interfere With Electric Threshold Recovery After Cochlear Implantation in the Aged Guinea Pig.Ear Hear. 2024 Nov-Dec 01;45(6):1554-1567. doi: 10.1097/AUD.0000000000001545. Epub 2024 Jul 12. Ear Hear. 2024. PMID: 38992863 Free PMC article.
-
The Black Book of Psychotropic Dosing and Monitoring.Psychopharmacol Bull. 2024 Jul 8;54(3):8-59. Psychopharmacol Bull. 2024. PMID: 38993656 Free PMC article. Review.
-
Ginkgo biloba for tinnitus.Cochrane Database Syst Rev. 2022 Nov 16;11(11):CD013514. doi: 10.1002/14651858.CD013514.pub2. Cochrane Database Syst Rev. 2022. PMID: 36383762 Free PMC article.
-
Multidisciplinary collaborative guidance on the assessment and treatment of patients with Long COVID: A compendium statement.PM R. 2025 Jun;17(6):684-708. doi: 10.1002/pmrj.13397. Epub 2025 Apr 22. PM R. 2025. PMID: 40261198
References
-
- Vehar, S., Boushra, M., Ntiamoah, P. & Biehl, M. Post-acute sequelae of SARS-CoV-2 infection: Caring for the ‘long-haulers’. Cleve Clin. J. Med.88 (5), 267–272 (2021). - PubMed
MeSH terms
Grants and funding
LinkOut - more resources
Full Text Sources
Medical
Miscellaneous
